 Florence Nightingale - Statistical Links
"To understand God's thoughts we must study statistics, for these are the measure of His purpose". Florence Nightingale
Florence Nightingale - Statistical Links
"To understand God's thoughts we must study statistics, for these are the measure of His purpose". Florence Nightingale
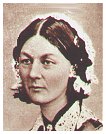
Florence Nightingale's role in the history of statistics and statistical graphics is of interest for many reasons. Of greatest interest here, was her role as a social activist and view that statistical data, presented in charts and diagrams, could be used as powerful arguments for medical reform.
Influenced perhaps by Quetelet in Belgium, and William Farr in England, she developed the idea that social phenomena could be objectively measured and subjected to mathematical analysis. She was an innovator in the collection, tabulation, interpretation, and graphical display of descriptive statistics. In statistical graphics, she is often credited as the inventor of the polar-area diagram (or "Coxcomb" diagram, rose diagram), although this graphic form was used earlier by both Andre-Michel Guerry (1829) and William Farr (1852).