SAS Macro Programs for Statistical Graphics: DENSITY
$Version: 1.1 (21 Sep 2001)
Michael Friendly
York University
The DENSITY macro calculates a nonparametric density estimate of a
data distribution as described in "Section
3.4". The macro produces the output data set specified by the
OUT= parameter. Starting with version 1.1, the macro also produces a
high-resolution plot with PROC GPLOT. The output data set
contains the variables DENSITY and WINDOW in addition to the
variable specified by the VAR= parameter.
A typical plotting step, using the defaults, OUT=DENSPLOT and
VAR=X, would be:
proc gplot data=densplot;
   plot density * X ;
   symbol1 i=join v=none;
Parameters
- DATA=_LAST_
- Name of the input data set
- OUT=DENSPLOT
- Name of the output data set
- VAR=X
- Name if the input variable (numeric)
- WINDOW=
- Bandwidth (H) for kernel density estimate
- XFIRST=.
- Smallest X value at which density estimate
is computed. If XFIRST = ., the minimum value
of the VAR= variable is used.
- XLAST=.
- Largest X value at which density estimate
is computed. If XLAST = ., the maximum value
of the VAR= variable is used.
- XINC=.
- Step-size (increment) for computing density
estimates. If XINC = ., the increment is
calculated as values, XINC = (XLAST-XFIRST)/60.
- GPLOT=YES
- Change this to NO to suppress the plot.
- symbol=
- SYMBOL statement to be used to define how the points
are plotted. If not specified, the program uses
symbol1 v=star i=join c=black;
- HAXIS=
- AXIS statement for horizontal axis. Use this to
change the way the horizontal axis is scaled or labelled., e.g.,
HAXIS=AXIS1 together with the statement,
axis1 order=(0 to 100 by 10) label=(f=swiss);
to change the default plotting range and font label.
- VAXIS=
- AXIS statement for vertical axis
- PLOTOPT=
- other plot options, eg %str(areas=1) to fill the
area under the curve. (For area fill, you should define
the fill pattern with a PATTERN statement.)
- ANNO=
- The name of an optional annotate= data set to be
added to the plot.
- SHOWOBS=YES
- If specified, the observations are indicated with
short vertical lines at the bottom of the plots.
Example
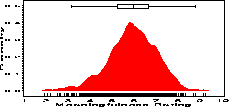
The following example shows a density display of the distribution of
rated meaningfulness for a collection of 925 English words, and illustrates
the use of various graphic options. The boxplot
at the top of the figure is drawn using the %boxaxis macro, giving an alternative display of the distribution. The offset option on the axis1 statement allows white space at the
bottom of the graph for the observation markers drawn as a result of the
SHOROBS=YES option.
axis1 order=(0 to .5 by .1) label=(a=90 'Density')
		offset=(3,);
pattern1 v=solid c=red;
symbol1 v=none i=join c=black;

%boxaxis(data=paivio, out=boxanno, var=meaning, pos=96, boxwidth=5);
%density(data=paivio, var=meaning, out=densplot,
	vaxis=axis1, haxis=axis2,
	symbol=symbol1,
	anno=boxanno,
	plotopt=%str(areas=1));

