SAS Macro Programs for Statistical Graphics: PARTIAL
$Version: 1.8 (23 Nov 2003)
Michael Friendly
York University
The PARTIAL macro draws partial regression plots as
described in "Section 5.5". These are high-resolution versions of
the plots produced by the PARTIAL option of the REG procedure,
with options for labelling influential points.
Version 1.6 of the macro has been made more computationally efficient
following (Velleman and Welsch, 1981),
allows SAS shorthand notation (X1-X5, AGE--WEIGHT, or _NUMERIC_)
for the list of predictors in the XVAR= option,
and also provides partial residual plots ("added-variable" or
"component-plus-residual" plots), as specified by the TYPE=
parameter.
Parameters
- DATA = _LAST_
- Name of the input data set. If not specified,
the most recently created data set is used.
- YVAR =
- Name of the dependent variable in the model.
- XVAR =
- List of independent variables in the model. The list of
variables may be given explicitly or using the range
notation X1-X n.
- ID =
- Name of an optional character or numeric variable used
to label observations. If ID= is not
specified, the observations are identified by
the numbers 1, 2, ...
- LABEL=INFL
- Specifies which points in the plot should
be labelled with the value of the ID= variable.
If LABEL=NONE, no points are labelled; if
LABEL=ALL, all points are labelled; otherwise
(LABEL=INFL) only potentially influential
observations (those with large leverage values
or large studentized residuals) are labelled.
- OUT =
- Name of the output data set containing
partial residuals. This data set contains
( p + 1 ) pairs of variables, where
p is the number of XVAR= variables. The
partial residuals for the intercept are named
UINTCEPT and VINTCEPT. If XVAR=X1 X2 X3, the
partial residuals for X1 are named UX1 and VX1,
and so on. In each pair, the U variable
contains the partial residuals for the
independent (X) variable, and the V variable
contains the partial residuals for the
dependent (Y) variable.
- HTEXT
- Specifies the height of text labels in the
plots.
- PLOTS=&XVAR
- Specifies which partial plots to produce.
This can be a subset of the XVAR variables, or
INTCEPT &XVAR to include the partial plot for
the intercept, or NONE if no plots are desired.
- TYPE=PARTREG
- TYPE=PARTREG (the default) produces partial
regression plots, in which all other variables are partialled from both
the Y and X variables. TYPE=PARTRES produces partial residual
plots.
- GOUT=GSEG
- Name of graphic catalog used to store the
graphs for later replay.
- NAME=PARTIAL
- The name assigned to the graphs in the
graphic catalog.
Computing note
In order to follow the description in the text, the program
computes one regression analysis for each regressor
variable (including the intercept). Velleman & Welsh (1981) show
how the partial regression residuals and other regression
diagnostics can be computed more eficiently--from the results of a
single regression using all predictors. They give an outline of
the computations in the PROC MATRIX language.
Usage Note
When using the PARTIAL macro with the SAS System for Personal
Computers, it may be neccessary to add the option WORKSIZE=100 to
the PROC IML statement.
Example
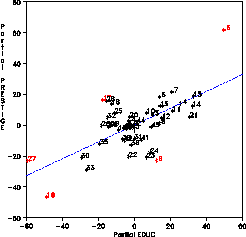
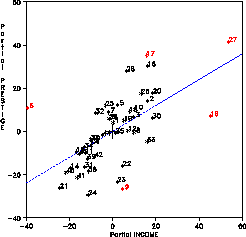
This example produces partial residual plots for the Duncan
data on the relation between occupational prestige and
income and education. These statements produce the figures below:
title h=1.5 'Partial regression residuals';
%include data(duncan);

%partial(data=duncan,
   yvar=prestige,xvar=educ income,
   id=case,label=ALL);
Two plots are produced.
All obsservations are labelled with their CASE number;
observations which are eitherinfluential, or high-leverage points
are drawn in red.


