| addvar | Added variable plots for logistic regression | addvar |
TYPE=AVP) for the effect of adding a variable to a logistic regression model, or a
constructed variable plot (TYPE=CVP) for the effect of transforming a variable.
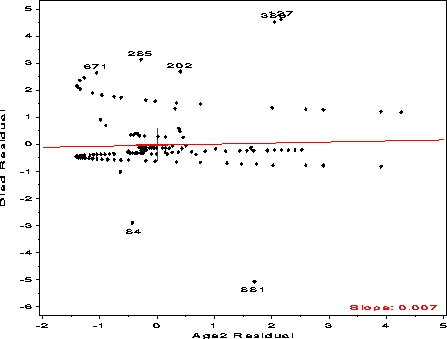
For a model with a binary response, Y, and predictors in the list X, an added variable plot may be constructed for a new predictor, Z, by plotting the residuals of Y given X against the residuals of Z given X. A linear relation in this plot indicates that Z should be included in the model, but observations with extreme Z-residuals would be highly influential in this decision. A line fitted to this plot should have an intercept approximately zero, and a slope approximating the coefficient of Z in the full model.
The constructed variable plot is designed to detect nonlinear dependence of
Y on one of the X variables, say X[j]. It is an added variable plot for the
constructed variable, Z = X[j] log X[j].
The arguments may be listed within parentheses in any order, separated by commas. For example:
  %addvar(data=icu, y=Died,  x=age admit cancer uncons, z=Systolic,
     id=patient, loptions=order=data noprint);
This gives an AVP for the variable Systolic, when added to the X=
variables in the model predicting Y=DIED.
DATA=_LAST_]
LOPTIONS=NOPRINT]
SMOOTH=0.5]
SUBSET=ABS(STUDRES)>2]
OUT=_RES_]
SYMBOL=DOT]
INTERP=RL CI=RED]
TYPE=AVP]
NAME=ADDVAR]
%include vcd(addvar);        *-- or include in an autocall library;
%include data(icu);

  %addvar(data=icu, y=Died,  x=age admit cancer uncons, z=Systolic,
     id=patient, loptions=order=data noprint);
