Visualizing Categorical Data: agree
$Version: 1.1 (12 Jan 1998)
Michael Friendly
York University
Agreement chart for n x n table
The AGREE program is a collection of SAS/IML modules for preparing observer
agreement charts which portray the agreement between two raters.
The modules are typically loaded into the SAS/IML workspace with the
%include statement. The required input parameters are
specified with IML statements, and the AGREE module is called as follows,
  proc iml;
     %include 'path/to/agree.sas';
     *-- set global variables, if desired;
     font = 'hwpsl009';

     *-- data, labels, title, weights;
     freq = { ... };
     vnames = {...};
     lnames = {...};
     title  = '...';
     w = 1;         *-- diagonals only;
     run agree(freq, w, vnames, lnames, title);
The required parameters for the RUN AGREE statement are:
- table
-
A square numeric matrix containing the contingency table to be analyzed.
- weight
-
A vector of one or more weights used to give ``partial credit'' for
disagreements by one or more categories. To ignore all but exact
agreements, let weight=1. To take into account agreements one-step apart
(with a weight of 5/6), let
weight={1 5/6}.
- vnames
-
A character vector of two elements, containing the names of the row and
column variables.
- lnames
-
A character vector containing the names of the row and column categories.
If table is n x n, then lnames should contain n elements.
- title
-
A character string containing the title for the plot.
The program uses two global variables to determine the font and character
height for text in the agreement chart.
- font
-
A character string specifying the font used. The default is Helvetica
('hwpsl009') if a PostScript driver is being used, SWISS otherwise.
- htext
-
A numeric value specifying the height of text characters.
Example
proc iml;
   %include iml(agree);
   table =
     {  7     7     2      3,
        2     8     3      7,
        1     5     4      9,
        2     8     9     14 };
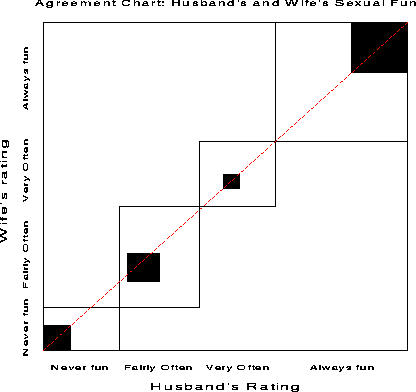
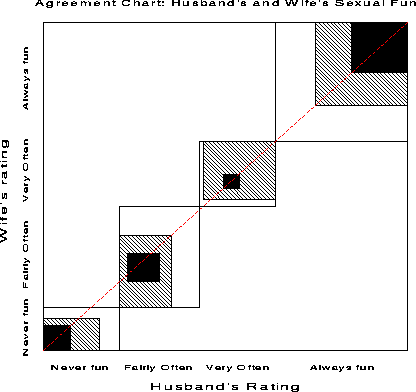
   title  = "Agreement Chart: Husband's and Wife's Sexual Fun";
   vnames = {"Husband's Rating" "Wife's rating"};
   lnames = {'Never fun' 'Fairly Often' 'Very Often' 'Always fun'} ;
   font = 'hwpsl009';

   w=1;
   run agree(table, w, vnames, lnames, title);
   w = w || (8/9);
   run agree(table, w, vnames, lnames, title);
quit;


See also
mosaic Macro interface for mosaic displays
sieve Sieve diagrams for two-way tables

