| sieveplot | Macro program for sieve diagrams | sieveplot |
The SIEVEPLOT macro provides a more convenient macro interface to
the SAS/IML modules for sieve diagrams, so that you can input
a SAS data set (in frequency form), rather than constructing the
arrays used by the IML modules. It also provides the
means to produce multiple sieve plots for two-way tables stratified
by other BY= variables.
The arguments may be listed within parentheses in any order, separated by commas. For example:
%sieveplot(data=haireye, var=Eye Hair, filltype=obsp)
DATA=_LAST_]
BY= variables. The first
two variables are used as the rows and columns of the
sieve diagram.
BY= variables. The BY= variable(s) *must* be listed among
the VAR= variables.
COUNT=COUNT]
COLORS=BLUE RED]
FILLTYPE=OBS]
OBS: fill cells in proportion to observed frequencies
'OBSP: like OBS, but also write obs. freq. in cell
'DEV: fill in proportion to deviations from independence.
'EXL: no fill, write expected frequency in cell
'EXP: expfill, write expected frequency in cell
HTEXT=1.5]
%include macros(sieveplot);        *-- or include in an autocall library;

  *-- Three way table, Hair color x Eye color x Sex;
  %include catdata(hairdat3);

  *-- Separate plots for males and females;
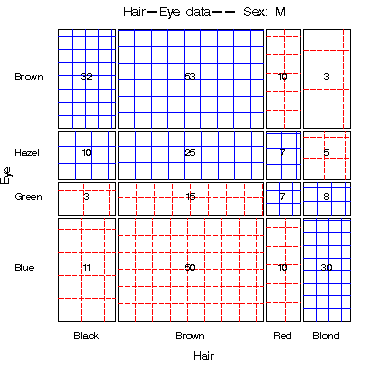
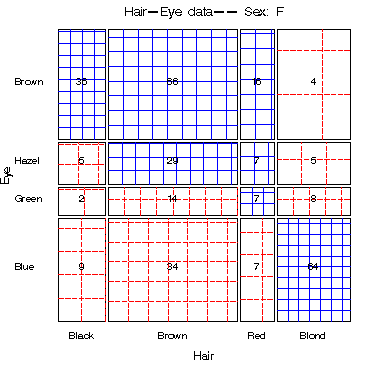
  %sieveplot(data=haireye, var=Eye Hair Sex, by=Sex, title=Hair-Eye data--,
      filltype=obsp);
Produces:


  *-- Collapse the table over Sex;
  %table(data=haireye, var=Eye Hair, order=data,
       weight=count, out=haireye2);

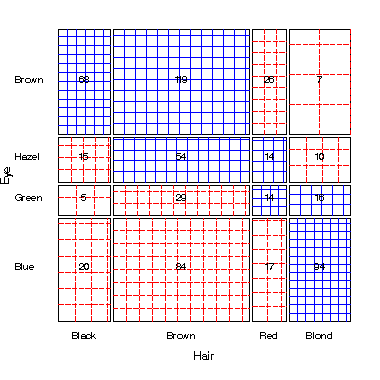
  %sieveplot(data=haireye2, var=Eye Hair, filltype=obsp);
Produces:
