Visualizing Categorical Data: triplot
$Version: 1.2 (7 Apr 1998)
Michael Friendly
York University
Macro for trilinear plots
The TRIPLOT macro plots three variables (rows of an n x 3 table) in an
equilateral triangle, so that each point represents the proportions of each
variable to the total for that observation.
The TRIPLOT macro is called with keyword parameters. The names of three
variables must be given in the VAR= parameter. The arguments may be listed within parentheses in any order,
separated by commas. For example:
  data tridemo;
     input A B C point $12.;
     label point='Point';
  cards;
  40 30 30  (40,30,30)
  20 60 20  (20,60,20)
  10 10 80  (10,10,80)
  ;
  %triplot(var=A B C, class=Point, id=point, gridby=25,
     symbols=dot dot dot, idht=1.6, axes=bot,
     symht=4, gridclr=gray);
- DATA=
-
The name of data set to be plotted. [Default:
DATA=_LAST_]
- VAR=
-
The names of three variables used as the axes in the plot. The values of
each observation are normally all non-negative. Missing values are treated
as 0.
- CLASS=
-
The name of a class variable determining plotting symbol. Different values
of the CLASS= variable are represented by the values in the COLORS= and SYMBOLS= lists, used sequentially.
- ID=
-
The name of an observation identifier (label) variable
- BY=
-
The name of a BY variable, for separate plots
- WHERE=
-
WHERE-clause to subset observations to be plotted.
- IDHT=
-
Height of ID label [Default:
IDHT=2]
- IDCLR=
-
Color of ID label [Default:
IDCLR='BLACK']
- IDPOS=
-
Position of ID label [Default:
IDPOS=8]
- IDSUBSET=
-
A SAS expression (which may use any data set variables used to subset ID
labels. If an ID= variable is given, and the IDSUBSET= expression evaluates to non-zero, the observation is labelled in the plot.
[Default:
IDSUBSET=1]
- INTERP=
-
Interpolation between points, a SYMBOL statement option. If
INTERP=JOIN, points within the same CLASS= value are connected by lines. Most other SYMBOL statement interpolation
options would give bizare results. [Default: INTERP=NONE]
- SYMHT=
-
Height of point symbols [Default:
SYMHT=2]
- SYMBOLS=
-
A list of one or more symbols for points, corresponding to the levels of
the CLASS= variable. The symbols are reused cyclically if there are more class levels
than symbols. [Default:
SYMBOLS=%STR(DOT CIRCLE SQUARE $ : TRIANGLE = X _ Y)]
- COLORS=
-
A list of one or more colors for points, corresponding to the levels of the CLASS= variable. The colors are also reused cyclically as required. [Default:
COLORS=BLACK RED BLUE GREEN BROWN ORANGE PURPLE YELLOW]
- BACKCLR=
-
Background color inside the trilinear plot. [Default:
BACKCLR=WHITE]
- BACKPAT=
-
Background fill pattern. For a plot with a light gray background, for
example, specify
BACKPAT=SOLID and
BACKCLR=GRAYD0. [Default: BACKPAT=EMPTY]
- GRIDBY=
-
Grid line interval. For grid lines at 25, 50, and 75%, for example, specify
GRIDBY=25. [Default: GRIDBY=20]
- GRIDCLR=
-
Grid line color [Default:
GRIDCLR=GRAY]
- GRIDLINE=
-
Style of grid lines [Default:
GRIDLINE=34]
- AXES=
-
Type of axes, one of NONE, FULL, TOP, or BOT.
AXES=NONE draws no coordinate axes; AXES=FULL draws a line from 0 to 100% for each of the three coordinates;
AXES=TOP draws a line from the apex to the centroid only;
AXES=BOT draws a line from the centroid to the base only. [Default: AXES=NONE]
- AXISCLR=
-
Color of axis lines [Default:
AXISCLR=BLUE]
- AXISLINE=
-
Style of axis lines [Default:
AXISLINE=1]
- XOFF=
-
X offset, in %, for adjusting the plot [Default:
XOFF=2]
- XSCALE=
-
X scale factor for adjusting the plot. Before plotting the X coordinates
are adjusted by
X = XOFF + XSCALE * X. [Default: XSCALE=.96]
- YOFF=
-
X offset, in %, for adjusting the plot [Default:
YOFF=2]
- YSCALE=
-
Y scale factor for adjusting the plot. Before plotting the Y coordinates
are adjusted by
Y = YOFF + YSCALE * Y. [Default: YSCALE=.96]
- LEGEND=
-
The name of legend statement or 'NONE'. If LEGEND= is not specified, and there is more than one group defined by a CLASS= variable, a legend statement is constructed internally. If
LEGEND=NONE, no legend is drawn; otherwise the LEGEND= value is used as the name of a legend statement.
- LABHT=
-
Height of variable labels, in GUNITs [Default:
LABHT=2]
- LABLOC=
-
Location of variable label: 0 or 100 [Default:
LABLOC=100]
- NAME=
-
Name of the graphics catalog entry [Default:
NAME=TRIPLT]
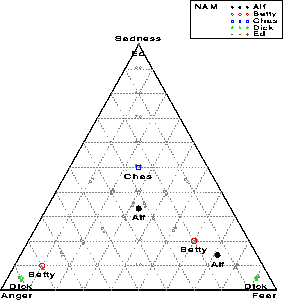
Example
%include vcd(triplot);        *-- or include in an autocall library;

data tripdemo;
	input anger fear sadness nam $;
	label anger='Anger' fear='Fear' sadness='Sadness';
cards;
20 20 20  Alf
80 10 10  Betty
25 25 50  Chas
90  5  5  Dick
 0  0 60  Ed
5  25  5  Alf
20 60 20  Betty
25 25 50  Chas
5  90  5  Dick
;
%triplot(var=anger fear sadness, class=nam, id=nam, gridby=10);

See also
