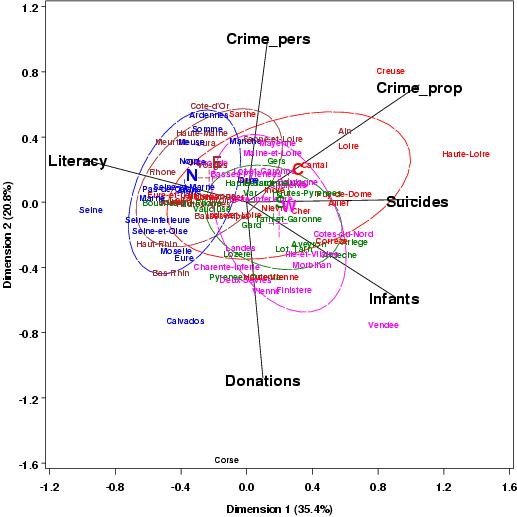
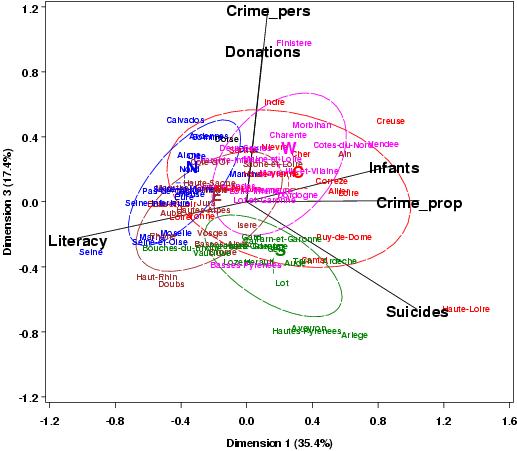
Biplots of Guerry data with data ellipses by region
Biplots (plots of variables: vectors and departments: points, in low-rank space), showing the relations
among the variables (angles between vectors) and the locations of departments in
relation to the variables and the biplot (principal component) dimensions.
- The departments are color-coded by region of France
- A data ellipse for each region is imposed on the plot to highlight the within-region
location, scatter, and covariation.
Resources
| Dimensions 1 & 2 |
Dimensions 1 & 3 |

|

|


