| agreeplot | Macro program for agreement plots | agreeplot |
The AGREEPLOT macro produces a graphic display of agreement in a square n x n contingency table, typically arising when observations are classified on the same scale by two raters or instruments. The display shows both the observed agreement and the expected agreement by superposed shaded and white rectangles, respectively.
This macro provides a more convenient macro interface to
the SAS/IML modules for agreement plots, so that you can input
a SAS data set (in frequency form), rather than constructing the
arrays used by the IML modules. It also provides the
means to produce multiple agreement plots for two-way tables stratified
by other BY= variables.
In SAS 9.3, these plots are now provided directly by PROC FREQ under
ODS graphics, when the AGREE option is specified on the TABLES statement.
Other PLOT()=AGREEPLOT sub-options allow some control of the details of
these plots.
DATA=_LAST_]
BY= variables. The first
two variables are used as the rows and columns of the
agreement plot.
BY= variables. The BY= variable(s) *must* be listed among
the VAR= variables.
COUNT=COUNT]
WEIGHTS=1 counts
only exact agreement. WEIGHTS=LIN2 or WEIGHTS=CA2 uses inverse
linear (Cicchetti-Allison) weights: 1, 1/(n-1) for an n x n
table. WEIGHTS=SQ2 or WEIGHTS=FC2 uses inverse square
(Fleiss-Cohen) weights, 1, 1/(n-1)**2. You can also use an
IML expression that evaluates to a row vector starting with 1,
e.g., WEIGHTS=1 || 1-1/(n-1) or WEIGHTS={1 0.5}.
COLORS=BLACK GRAY]
FILLS=SOLID LR]
HTEXT=1.5]
LABROT=0 90]
BY= variables, a string
indicating their levels is appended.
GOUT=WORK.GSEG]
NAME=AGREE]
The AGREEPLOT macro is defined with keyword parameters. The arguments may be listed within parentheses in any order, separated by commas. For example:
%agreeplot(data=sexfun, var=Husband Wife);
With BY= variables, the graphs are correct, but the BN statistics
dont use the given WEIGHTS.
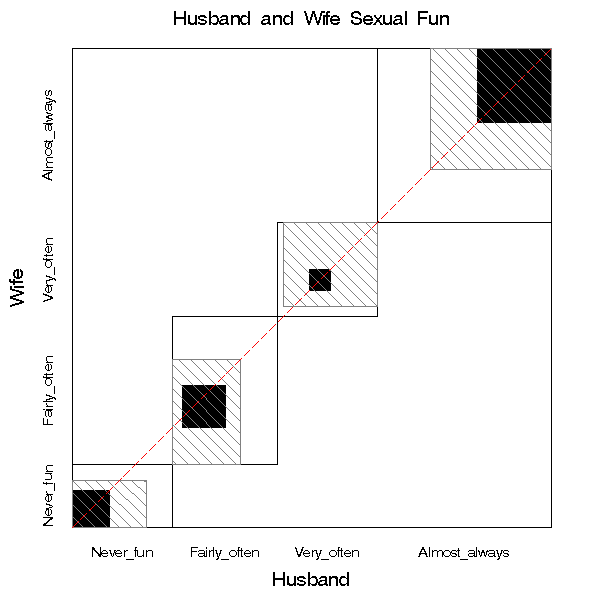
 proc format;
  value rating 1='Never_fun' 2='Fairly_often'
               3='Very_often' 4='Almost_always';
 data sexfun;
   label Husband = 'Husband rating'
          Wife    = 'Wife Rating';
   format Husband Wife rating.;
   do Husband = 1 to 4;
   do Wife    = 1 to 4;
     input count @@;
     output;
     end; end;
 datalines;
  7     7     2      3
  2     8     3      7
  1     5     4      9
  2     8     9     14
 ;
 *-- Convert numbers to formatted values;
 %table(data=sexfun, var=Husband Wife, char=true, weight=count, out=table);
 %agreeplot(data=table, var=Husband Wife, title=Husband and Wife Sexual Fun);
Output:
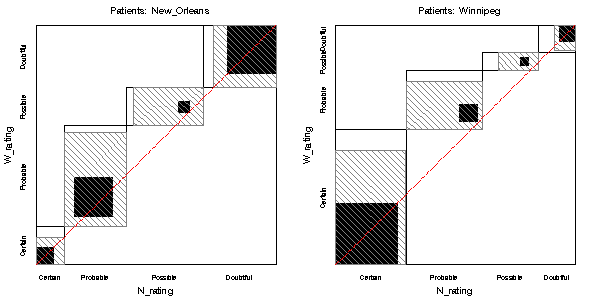
proc format;
     value rating 1="Certain" 2="Probable" 3="Possible" 4="Doubtful";
data msdiag;
     do Patients='Winnipeg   ', 'New_Orleans';
        do N_rating = 1 to 4;
           do W_rating = 1 to 4;
              input count @;
              output;
              end;
           end;
        end;
   format N_rating W_rating rating.;
   label N_rating = 'New Orleans neurologist'
         W_rating = 'Winnipeg neurologist';
datalines;
38  5  0  1
33 11  3  0
10 14  5  6
 3  7  3 10
 5  3  0  0
 3 11  4  0
 2 13  3  4
 1  2  4 14
;
%table(data=msdiag, var=Patients N_rating W_rating, weight=count, char=true, out=table);

%gdispla(OFF);
%agreeplot(data=table, var=Patients N_rating W_rating, by=patients, weights=FC2);
%gdispla(ON);

%panels(rows=1, cols=2, first=2);
Output: