| coplot |
Construct a conditioning plot - plots of y * x | z |
coplot |
SAS Macro Programs: coplot
$Version: 1.4 (04 Oct 2004)
Michael Friendly
York University
Construct a conditioning plot - plots of y * x | z
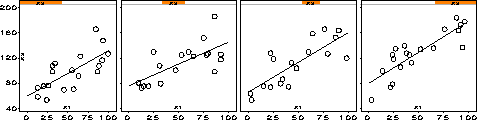
The COPLOT macro plots a collection of XY plots, for subsets of a data set
conditioned by a GIVEN= variable. These help to show how the relation between X and Y varies with
the given variable. A poor-man's version of the Trellis display.
The COPLOT macro is defined with keyword parameters. The X=, Y=, and GIVEN= parameters are required. Either or both of the ROWS=
and COLS= parameters may be used to arrange the collection of plots in a rectangular
grid.
The arguments may be listed within parentheses in any order, separated by
commas. For example:
%coplot(x=weight, y=mpg, given=Origin);
- DATA=
-
Name of the data set to be plotted [Default:
DATA=_LAST_]
- X=
-
Horizontal variable in each plot
- Y=
-
Vertical variable in each plot
- GIVEN=
-
The name of the slicing variable. May be a numeric
or character variable. If numeric, it it treated as
continuous, and sliced as determined by the SLICES and
OVERLAP parameters.
A character GIVEN= variable is treated as discrete,
with no OVERLAP between slices.
- GROUP=
-
Grouping variable (determines the plot symbol/color)
- SLICES=
-
Number of slices of the GIVEN= variable [Default:
SLICES=4]
- OVERLAP=
-
Allowed overlap between slices [Default:
OVERLAP=0.25]
- ROWS=
-
Number of rows in the panel plot. If neither ROWS= nor
COLS= are specified, both values are calculated from the
SLICES= value to give a square-ish display. If only one of ROWS= or COLS= is specified, the other value is calculated.
- COLS=
-
Number of columns in the panel plot.
- INTERP=
-
Plot interpolation method used in each panel. E.g., INTERP=RL
fits and draws a linear regression line. [Default:
INTERP=NONE]
- HSYM=
-
Height of plot symbols and value labels in the plots.
- GPANEL=
-
Height of the given panel, in % of the plot size. If
GPANEL=0, the given panel is suppressed. [Default: GPANEL=0]
- SYMBOLS=
-
List of symbols to use for for groups defined by the GROUP=
variable. [Default:
SYMBOLS=%STR(CIRCLE SQUARE + : $ = X _ Y)]
- COLORS=
-
List of colors to use for for groups. [Default:
COLORS=BLACK RED GREEN BLUE BROWN YELLOW ORANGE PURPLE]
- GOUT=
-
Name of the output graphics catalog. [Default:
GOUT=GSEG]
Limitations
The plots are drawn separately, then composed into one figure with
PROC GREPLAY (the PANELS macro). As a result:
- The Given panel does not work very well (font shapes are horribly
mangled)
Axis labels and values for the X and Y variables are not handled
very nicely.
Example
%include macros(coplot);        *-- or include in an autocall library;

data test;
  drop i;
  do i=1 to 60;
     gp = 1 + mod(i,4);
     x1 = round( 100*uniform(0));
     x2 = round( 100*uniform(0)) + x1 + 4*gp;
     x3 = round( 100*uniform(0)) - x1 + x2 - 4*gp;
     output;
     end;

%coplot(data=test,
	x=X1, y=X2, given=X3, slices=4, overlap=.25,
	interp=rl, rows=1);
See also
panels
scatmat