genscat Generalized scatterplot matrix genscat

SAS Macro Programs: genscat

$Version: 1.0 (17 Jul 2001)
Michael Friendly
York University


The genscat macro ( [download] get genscat.sas)

Generalized scatterplot matrix

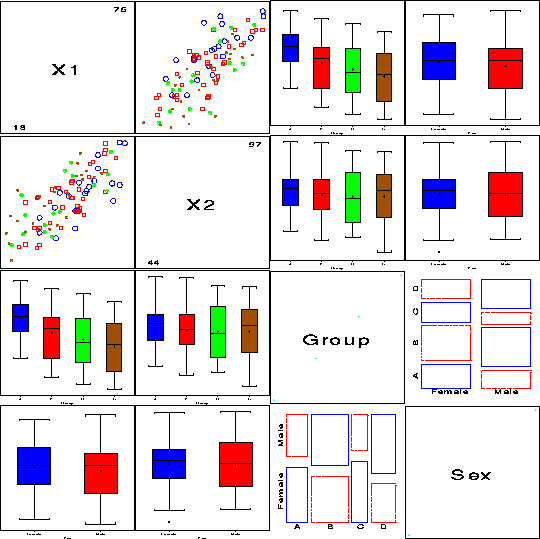
The GENSCAT macro produces generalized scatterplot matrix for all pairs of variables, which may be categorical or numeric (Friendly, 1999). For pairs consisting of two numeric variables, an ordinary scatterplot is produced; pairs of two categorical variables are shown by a mosaic plot; pairs of one categorical and one numeric variable are shown by boxplots.

Usage

The GENSCAT macro is defined with keyword parameters. The arguments may be listed within parentheses in any order, separated by commas. For example:

  %genscat(data=test, var=X1 X2 Group Sex, group=gp);

Parameters

DATA=
Name of the data set to be plotted. [Default: DATA=_LAST_]
VAR=
List of the variables to be plotted. You can use any of the standard SAS abbreviations. [Default: VAR=_NUMERIC_]
NAMES=
Alternative variable names used to label the diagonal cells
TYPES=
List of variable types, corresponding to the names in VAR= used to override the default treatment of numeric variables: a list of C and N.
GROUP=
Grouping variable (determines plot symbols in scatterplots)
INTERP=
Plot interpolation method [Default: INTERP=NONE]
HSYM=
Height of plot symbols
HTITLE=
Height of variable name titles for diag panels
PLOTOPT=
Additional plot options
SYMBOLS=
List of symbols used for observations in scatterplots. [Default: SYMBOLS=%STR(CIRCLE SQUARE + : $ = X _ Y)]
COLORS=
List of colors used in scatterplots and boxplots. [Default: COLORS=BLUE RED GREEN BROWN BLACK YELLOW ORANGE PURPLE]
ANNO=
Annotate diagonal or off-diag plot. At present, ANNO=BOX adds a boxplot to diagonal plots, ANNO=ELLIPSE adds a data ellipse to off-diagonal plots for pairs of numeric variables. [Default: ANNO=NONE]
GTEMP=
Temporary graphics catalog. For repeated use within the SAS Session Manager, need to start a new catalog, and kill it at the end. [Default: GTEMP=GTEMP]
KILL=
Delete GTEMP when done [Default: KILL=Y]
GOUT=
Name for output graphics catalog [Default: GOUT=GSEG]
NAME=
Graph name in output graphics catalog [Default: GOUT=GENSCAT]

Dependencies

GENSCAT requires the following macros:

gdispla gensym boxaxis contour table mosaic boxplot panels

References

Friendly, M. ``Extending Mosaic Displays: Marginal, Conditional, and Partial Views of Categorical Data'', JCGS, 8:373-395, 1999. ../papers/drew/drew.pdf

Example

Two numeric and two categorical variables:
%include macros(genscat);        *-- or include in an autocall library;

data test;
  drop i;
  do sex='Male  ', 'Female';
  do i=1 to 50;
     gp = rantbl(0, .25, .35, .15, .25);
     group = substr('ABCD', gp,1);
     x1 = round( 80*uniform(0)) - 5*gp;
     x2 = round( 80*uniform(0)) + x1 - 50 + 5*gp;
     output;
     end;
	 end;
run; 
%genscat(data=test, var=X1 X2 Group Sex, group=gp);
See also

boxanno Annotate a scatter plot with univariate boxplots
boxplot Box-and-whisker plots
ellipses Plot bivariate data ellipses
gensymGenerate SYMBOL statements
mosaic Macro interface for mosaic displays
mosaics SAS/IML programs for mosaic displays
table Construct a grouped frequency table, with recoding
panels Display a set of plots in rectangular panels