| mvinfluence | Influence measures for multivariate regression | mvinfluence |
The MVINFLUENCE macro calculates and plots measures of influence in a multivariate regression model. These are generalizations of the usual influence measures for univariate regression described by Barrett & Ling (1992). This is an initial, experimental implementation designed to explore thiese methods.
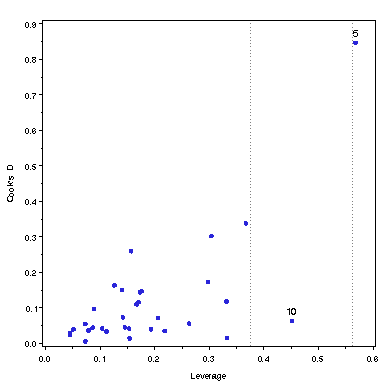
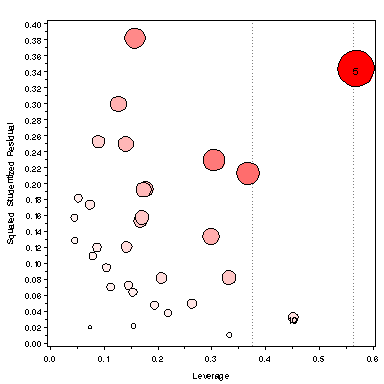
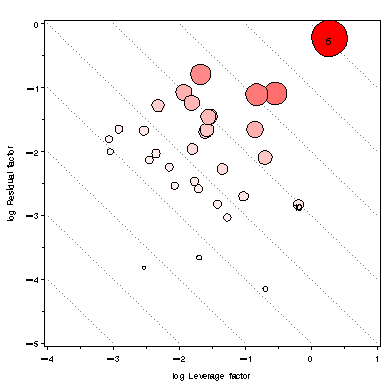
Three types of plots are provided (controlled by the PLOTS= argument)
The MVINFLUENCE macro is defined with keyword parameters. The arguments may be listed within parentheses in any order, separated by commas. For example:
%mvinfluence(data=rohwer, x=n s ns na ss, y=SAT PPVT Raven)
DATA=_LAST_]
BUBBLE=COOKD]
OUT=COOKD]
OUT= data set? Not yet implemented. [Default: PRINT=NONE]
PLOTS=ALL]
LABEL=INFL]
HTEXT= goption [Default: LSIZE=1.6]
LCOLOR=BLACK]
LPOS=5]
BSIZE=10]
BSCALE=AREA]
BCOLOR=RED]
REFCOL=BLACK]
REFLIN=33]
NAME=MVINFL]
%gskip - gskipDevice-independent macro for multiple plots
%labels - labels Create an Annotate dataset to label observations
* Barrett, B. E. & Ling, R. F. (1992). General classes of influence measures for multivariate regression, JASA, 87, # 417, 184-191.
* Barrett, B. E. (2003): Understanding Influence in Multivariate Regression, Communications in Statistics - Theory and Methods, 32:3, 667-680
* Some code from Timm & Mieczkowski, Univariate and Multivariate General Linear Models, http://ftp.sas.com/samples/A55809, Program 5_6.sas, was used in the initial implementation.
  %include data(rohwer);
  data rohwer;
     set rohwer;
     where group=2;
     drop subjno;
     case = _n_;
  %include macros(mvinfluence);        *-- or include in an autocall library;
  %mvinfluence(data=rohwer, x=n s ns na ss, y=SAT PPVT Raven, id=case,
  bfill=gradient, plots=ALL);
The following plots are produced:


