Visualizing Categorical Data: sieve
$Version: 1.4 (6 Apr 1998)
Michael Friendly
York University
Sieve diagrams for two-way tables
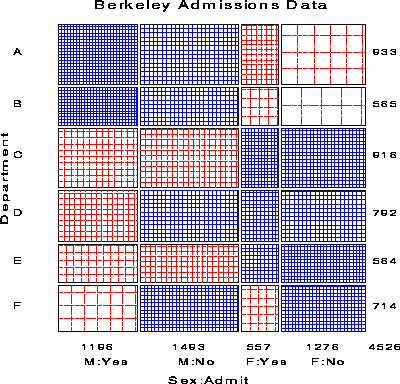
The SIEVE program is a collection of SAS/IML modules for drawing sieve (or
parquet) diagrams for a two-way contingency table.
  proc iml;
  %include iml(sieve);
  run sieve( f, vnames, lnames, title );
The required parameters for the RUN SIEVE statement are:
- f
-
A two-way contingency table, size r x c
- vnames
-
Variable names, a 1x2 character matrix. vnames[,1]=row variable,
vnames[,2]=column variable
- lnames
-
Category names, a 2 x
max(r,c) character matrix.
lnames[1,]=row categories, vnames[2,]=column categories.
- title
-
Plot title
- filltype
-
- OBS
-
fill cells in proportion to observed frequencies
- OBSP
-
like OBS, but also write obs. freq. in cell
- DEV
-
fill in proportion to deviations from independence.
- EXL
-
no fill, write expected frequency in cell
- EXP
-
fill in proportion to exp, write expected frequency in cell
- margins
-
- ''
-
nothing in margins
- TOTALS
-
row/col totals in margins
- font
-
font for text
- colors
-
Names of two colors to use for the positive and negative residuals.
[Default: {BLUE RED}]
Example
proc iml;
   %include iml(sieve);
   vnames = {'Department' 'Sex:Admit' };
   lnames = { 'A' 'B' 'C' 'D' 'E' 'F',
             'M:Yes' 'M:No' 'F:Yes'  'F:No' ' ' ' '};
          /*   Males       Females  */
   table = { 512  313      89   19,
             353  207      17    8,
             120  205     202  391,
             138  279     131  244,
              53  138      94  299,
              22  351      24  317};
   font='hwpsl009';
   title  = 'Berkeley Admissions Data';
   margins = 'TOTALS';
   run sieve(table, vnames, lnames, title );

See also
agree Agreement chart for n x n table
fourfold Fourfold display for 2 x 2 x k tables
mosaics SAS/IML programs for mosaic displays
mosaic Macro interface for mosaic displays
