SAS Macro Programs: sunplot
$Version: 1.3-1 (03 Jun 2007)
Michael Friendly
York University
Sunflower plot for X-Y dataset
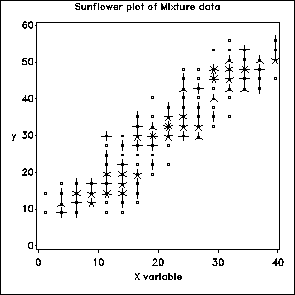
The sunflower plot displays a bivariate dataset using "sunflower
symbols" to show the number of observations in the neighborhood
of each XY point.
Method
The dataset is first "binned" into cells, and the number of observations
in each cell is counted.
The count in each cell is plotted using the appropriate character
from the SUNFONT.
Requires that the program
sunfont.sas
must first be run to create the sunflower 'sun' font in the libname designated by
gfont0.
Usage
sunplot is a macro program. Values must be supplied for the X
and Y variables.
The arguments may be listed within parentheses in any order, separated
by commas. For example:
%sunplot(data=inputdataset, x=income, y=prestige );
Parameters
Default values are shown after the name of each parameter.
- DATA=_LAST_
- The name of the input dataset. If not specified, the most
recently created dataset is used.
- X=X
- name of the horizontal variable
- Y=Y
- name of the vertical variable
- NX=20
- number of slices of the horizontal var
- NY=20
- number of slices of the vertical var
- COLOR=BLACK
- color for plotting symbols
- HSYM=1.5
- symbol height
- VAXIS=
- optional name of axis statement for vertical axis
- HAXIS=
- optional name of axis statement for horizontal axis
- PLOTOPT=NOLEGEND FRAME
- additional plot options
- NAME=SUN
- nsme of graphics catalog entry
Dependencies
You also need to obtain and run sunfont.sas (once) to create the sunflower font.
This font is stored in the library (folder) referenced by the
LIBNAME GFONT0.
Example
%include macros(sunplot);        *-- or include in an autocall library;
data suntest;
    label x='X variable';
	 drop i;
    do gp=1 to 3;
       mx = 10*gp;
       my = mx;
       do i = 1 to 100;
          x = round((mx + 5 * normal(1242421)), .5);
          y = round((my + 3 * normal(2424243) + .5*x), .5);
          output;
       end;
    end;
run;

title1 h=1.5  f=duplex 'Sunflower plot of Mixture data';
   axis1 order = 0 to 60 by 10  label=(h=1.5) value=(h=1.5)
         minor = none;
   axis2 order = 0 to 40 by 10  label=(h=1.5) value=(h=1.5)
         minor = none;

%sunplot(data=suntest, x=X, y=Y, nx=20, ny=20, vaxis=axis1, haxis=axis2);

See also
ellipses Plot bivariate data ellipses
lowess Locally weighted scatterplot smoother
