689 x 546
Hertzsprung, E. 1911
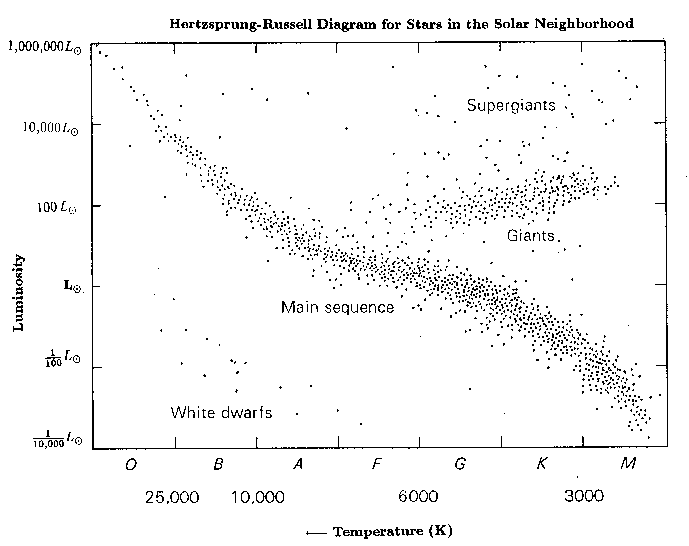
The Hertzsprung-Russell diagram, a log-log plot of luminosity as a function of temperature for stars, used to explain the changes as a star evolves. It provided an entirely new way to look at stars, and laid the groundwork for modern stellar physics and evolution, developed independently
Milestones Item