If the early 1800s were the ``golden age'' of statistical graphics and
thematic cartography, the early 1900s could be called the ``modern dark
ages'' of visualization [
85].
There were few graphical innovations, and, by the mid-1930s, the
enthusiasm for visualization which characterized the late 1800s had been
supplanted by the rise of quantification and formal, often statistical,
models in the social sciences. Numbers, parameter estimates, and,
especially, standard errors were precise. Pictures were- well, just
pictures: pretty or evocative, perhaps, but incapable of stating a
``fact'' to three or more decimals. Or so it seemed to statisticians.
But it is equally fair to view this as a time of necessary
dormancy, application, and popularization, rather than
one of innovation. In this period statistical graphics
became ``main stream.'' Graphical methods entered textbooks
[228,107,128,222,157],
the curriculum [48,317], and standard use in
government [9], commerce [101,263] and science.
In this period graphical methods were used, perhaps for the first time,
to provide new insights, discoveries, and theories in astronomy, physics,
biology, and other sciences. As well, experimental comparisons of the
efficacy of various graphics forms were begun, e.g., [63],
and a number of practical
aids to graphing were developed. In the latter part of this period,
new ideas and methods for multi-dimensional data in statistics and
psychology would provide the impetus to look beyond the 2D plane.
Graphic innovation was also awaiting new ideas and technology: the
development of the machinery of modern statistical methodology, and the
advent of the computational power which would support the next wave of
developments in data visualization.
- 1901
-
Attempt to formulate standards for graphical procedures at the International Statistical Congress; proposes
that x,y scales be constructed so that the average behaviour corresponds to a curve of 45 degrees. Report
not adopted, see [92,p. 321]; see also [141].-
Jacques Bertillon (1851-1922) and Émile Cheysson (1836-1910) and M. Fontaine , Budapest, Hungary [141].

PIC: Cheysson portrait (295 x 378; 12K)
TXT: Cheysson biography
TXT: Link to Cheysson's e-texts
Some of the other recommendations also included cautious use of symbols and hieroglyphs, and sparing use of comparison by areas.
- 1904
-
Use of the ``butterfly diagram'' to study the variation of sunspots over time, leading to the discovery that they were markedly reduced in frequency from 1645-1715 (the ``Maunder minimum'').
[Earlier work, started in 1843 by H. Schwabe, showed that sunspots exhibit an approximately
twenty-two year cycle, with each eleven-year cycle of sunspots followed by a reversal of the direction of the sun's magnetic field]-
Edward Walter Maunder (1851-1928), England
IMG: Maunder's butterfly diagram (250 x 150; 22K)
TXT: The butterfly diagram
TXT: The sunspot cycle
- 1905
-
Lorenz curve (cumulative distribution by rank order, to facilitate study of concentrations, income distribution)- Max Otto Lorenz (1880-1962), USA. [177].
TXT: Description of Lorenz Curve
IMG: Lorenz Curve (263 x 261; 6K)
- c. 1910
-
Statistical diagrams begin to appear regularly in USA textbooks (graphs of temperature, population in texts of arithmetic, algebra)- USA
- 1910
-
Textbook in English devoted exclusively to statistical graphics- John Bailey Peddle , USA [228].
- 1911
-
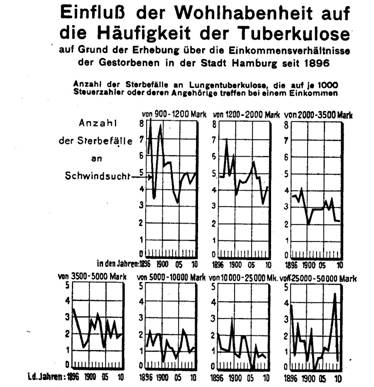
First International Hygiene-Exhibition in Dresden, with
259 graphical-statistical figures
of 35 national and international exhibitors and more than 5
million visitors. [Roesle also wrote publications which dealt with the
structure of graphical-statistical displays [256].]- Emil Eugen Roesle (organizer) (1875-1962),
Germany [255,220].
PIC: Rosele portrait (283 x 417; 17K)
FIG: Trellis-like time series graphs of infant mortality (600 x 594; 116K)
FIG: Trellis-like time series graphs of tuberculosis (374 x 387; 33K)
FIG: 3D Histogram: The course of death in Saxony (891 x 643; 98K)
- 1911-1913
-
The Hertzsprung-Russell diagram, a log-log plot of luminosity as a function of temperature for stars, used to explain
the changes as a star evolves. It provided an entirely new way to look at stars, and laid the groundwork for modern stellar physics and evolution, developed
independently by-
Ejnar Hertzsprung (1873-1967), Denmark [135] and Henry Norris Russell (1877-1957), USA. See [272]
for a recent appraisal.
PIC: Russell portrait (439 x 638; 21K)
IMG: Hertzprung's first 1911 graphs (366 x 394; 23K)
IMG: early Hertzsprung-Russell diagram (689 x 546; 8K)
IMG: modern Hertzsprung-Russell diagram (283 x 335; 26K)
TXT: HR Diagram tutorial
TXT: Hertzsprung biography
TXT: Russell biography
- 1913
-
Arithmetic probability paper, ruled so that normal ogive appears as straight line- Allen Hazen (1869-1930), USA [130].
IMG: Probability paper (590 x 303; 8K)
- 1913
-
Parade of statistical graphics, May 17, 1913, including large graphs on horse-drawn floats, and a photograph with people arranged in a
bell-shaped curve- Employees of New York City , New York, USA [33].
FIG: Photograph of the Parade of Statistical Graphics (504 x 407; 57K)
According to Brinton \cite{Brinton:1914}, the graph that most impressed people was one showing the decline in death rate due to improvements in sanitation and nursing.
- 1913
-
Discovery of the concept of atomic number, based largely on graphical analysis (a plot of serial numbers of the elements vs. square root of frequencies from X-ray spectra)
The linear relations showed that the periodic table was explained by atomic number rather than, as had been supposed, atomic weight, and predicted
the existence of several yet-undiscovered elements- Henry Gwyn Jeffreys Moseley (1887-1915), England [206].
TXT: Text of Moseley's article, with scanned graphs
IMG: Moseley graph image (345 x 543; 8K)
TXT: Henry Mosely biography
PIC: Moseley portrait (200 x 298; 14K)
- 1913-1914
-
College course in statistical graphic methods, ``The Graphic Method'' (possibly the first)- Martin F. P. Costelloe , Iowa State College, USA.[48]
- 1914
-
Published standards for graphical presentation (by representatives from several scientific societies) - American Society of Mechanical Engineers (Joint Committee), USA [156].
- 1914
-
Pictograms to represent a series of numbers by icons (combining concepts of the bar graph and pictogram of varying size)- Willard Cope Brinton , USA [33].
TXT: Google Books: Brinton's Graphic Methods for Presenting Facts
FIG: Comparative pictogram of copper production, Fig 25 (371 x 262; 19K)
FIG: Proportion of College Graduates, Fig 39 (526 x 537; 57K)
FIG: Ranks of states on educational features, Fig 33 (514 x 738; 112K)
- 1915
-
Creation of a standing committee on graphics- American Statistical Association , USA.
- 1915-1925
-
Beginnings of the development of modern statistical theory (sampling distributions (1915), randomization,
likelihood (1921), small sample theory, exact distributions, analysis of variance (1925), etc.)- Ronald Aylmer Fisher (1890-1962), UK [72,73].
PIC: R. A. Fisher portrait (268 x 326; 3K)
TXT: Fisher biography, with other links and portraits
TXT: Collected papers of R. A. Fisher
[23]
- 1916
-
Correspondence course in graphical methods (20 lessons for $50, supplemented by a book of 100 specimen
illustrations of bar, curve, and circle diagrams; entended title includes ``There's an idea in every chart'')-
Frank Julian Warne (1874-1948), USA [317].
- 1917
-
Gantt chart, designed to show scheduled and actual progress of projects- Henry Laurence Gantt (1861-1919), Maryland, USA[101].
TXT: Gantt chart history
As a mechanical engineer and management consultant, Gantt also designed the 'task and bonus' system of wage payment and developed methods of measuring worker efficiency and productivity.
- 1918-1933
-
Annual college course in statistical graphical methods- E. P. Cubberly , Stanford University, USA.
- 1919
-
Social statistical chartbook, containing a variety of graphic
and semi-graphic displays in a USA Government report. [The image below is a
fine early example of a semi-graphic display, showing four variables
simultaneously.]- Leonard Porter Ayres (1879-1946), USA [9].
FIG: American Divisions in France, WWI,
from [291] (467 x 429; 5K)
- 1919
-
Use of ethnographic maps, showing the distribution of mixed nationalities, played an important role in redrawing national boundaries of Central Europe and the Balkans following World War I- Emmanuel de Martonne (1873-1955), France [224,187,188].
PIC: de Martonne portrait (1190 x 1762; 202K)
FIG: Distribution of nationalities in the the countries dominated by Roumanians (2925 x 1959; 1026K)
TXT: Wikipedia entry for De Martonne (French)
De Martonne was a geographical expert and secretary of the Comit\'e d'\'etudes, established by the French in 1915 to prepare guidelines for peace and the demarcation of boundaries. In this work, he had to develop ways to represent mixed distributions of different ethnic groups
- 1920
-
Invention of the path diagram to show relations among a
network of endogenous and exogenous variables forming a system of structural
equations- Sewall Wright (1889-1988), USA [328].
PIC: Sewall Wright portrait (216 x 405; 15K)
FIG: Wright's first path diagram (682 x 563; 42K)
TXT: Sewall Wright Papers, from the American Philosophical Society
TXT: Biographical memoirs
- 1920-1926
-
Numerous textbooks on graphics, describing principles of graphical presentation of numerical information (published at a rate of
about two each year), e.g.,- A. C. Haskell [128], Karl G. Karsten , USA [157], A. R. Palmer ,
England [222].
- 1923
-
Invention of the iconoscope television camera-tube- Vladimir Kosma Zworykin (1889-1982), Russia.
PIC: Zworykin,portrait, with kinescope (200 x 218; 7.3K)
TXT: Zworykin biography and invention (with images)
- 1924
-
Museum of Social Statistical Graphics and the ISOTYPE system (International System of Typographic Picture Education)- Otto Neurath (Director) (1882-1945 ), Social and Economic Museum, Vienna, Austria [210,211].
PIC: Neurath portrait - small (104 x 150; 4K)
PIC: Neurath portrait - large (363 x 502; 29K)
IMG: Neurath Isotype image (215 x 300; 14K)
FIG: Births and deaths in Germany, from [210] (699 x 551; 43K)
FIG: Infant mortality and social position in Vienna, from [210] (500 x 320; 46K)
FIG: Number of men living in Europe, from [210] (551 x 451; 62K)
FIG: Isotype figure (400 x 229; 276k)
TXT: Neurath biography
TXT: Wikipedia: Neurath biography
- 1925
-
Development of the control chart for statistical
control of industrial processes- Walter A. Shewhart (1891-1967), USA[263].
PIC: Walter Shewhart portrait (82 x 109; 5K)
TXT: Collection of
web sites on Shewhart
- 1926
-
Experimental test of statistical graphical forms (pie vs. subdivided bar charts)- Walter C. Eells , USA [63].
IMG: Experimental stimuli (415 x 316; 96K)
- 1927-1932
-
Spate of articles on experimental tests of statistical graphical forms- R. von Huhn [140], F. E. Croxton [51,52,53], J. N. Washburne [318], USA.
FIG: Graphical image used by Washburne: Income (653 x 1120; 116K)
FIG: Graphical image used by Washburne: Population of Florence (647 x 295; 35K)
- 1927-1934
-
The birth of psychometrics, including unidimensional scaling (the law of comparative judgment) and multiple factor analysis. This would give rise to visualizations in one or more dimensions of psychological constructs, like attitudes, preferences, and abilities.- Louis Leon Thurstone (1887-1955), Chicago, USA [283,284].
PIC: Thurstone portrait (150 x 237; 9.8K)
FIG: Factorial diagram for study of radicalism and attitudes (500 x 398; 57K)
TXT: Wikipedia Thurstone biography
TXT: Thurstone, ``Vectors of the Mind''
- 1928
-
Nomogram of chemical concentrations in blood, showing the relations among over 20 components- Lawrence Joseph Henderson (1878-1942), USA [133].
IMG: Henderson nomogram icon (120 x 59; 5K)
FIG: Henderson nomogram image (1305 x 642; 226K)
TXT: Henderson biography (pdf)
- 1928
-
Ideograph, a multivariate rectangular glyph, invented to display four variables and their relations
(length and width of petals and sepals in iris flowers)-Edgar Anderson (1897-1969), USA
[3,161].
PIC: Portrait (150 x 200; 124k)
TXT: Brief biography
- 1929
-
Electroencephalograph invented, to record electrical signals from the brain via galvanometers that measure electrical signals from electrodes on the
scalp. EEGs were printed on multiple-pen, strip-chart recorders, with each channel showing the the amplitude from a given electrode.-
Hans Berger (1873-1941), Austria.
PIC: Berger portrait (125 x 190; 9K)
FIG: EEG machine (300 x 238; 23K)
In 1924, Berger made the first EEG recording in man and called it Electroenkephalogram. Berger was the first to describe the different brainwaves in the normal and abnormal brain. He also researched the nature of changes in EEG for brain diseases such as epilepsy.
- 1930
-
Table of historical events drawn on logarithmic paper- Heinz Von Foerster (1911-2002),Austria.
FIG: Table of historical events drawn on logarithmic paper
TXT: von Foerster biography
TXT: von Foerster interview and logarithmic timeline
TXT: Tabular representation of logarithic timeline
von Foerster observed that the closer to the present, the more densely filled the paper was with historical events; conversely, the further you went back the thinner the table. Plotting the data using a logarithmic time scale allowed the history of time to be plotted on one table.
- 1931
-
``Log Square'' paper (logy, logx, for relations which are linear in log scales)- F. C. Martin and D. H. Leavens , USA [186].
- 1933
-
Standard statistical symbols (Neurath's Isotype method) established by government decree (for schools, public posters, etc.)- Soviet Union [210].
- 1933
-
Re-design of the routes of the London underground rail system to favor usability- Henry C. Beck (1903-1974), London, UK.
PIC: Beck portrait (240 x 258; 20K)
FIG: Beck's initial underground map (450 x 308; 66K)
FIG: Modern London tube map following Beck
TXT: Wikipedia on Henry (Harry) Beck
TXT: Catalog of London Underground maps 1933-
Beck, an engineering draughtsman, designed the map like an electrical circuit board, using only vertical, horizontal and 45 degree angled lines. He located stations according to available space. The resulting map was geographically inaccurate, but easier to use to determine how to get from point A to B. Beck's idea was soon copied by most subway (and bus) companies around the world.
- 1935-1950
-
Lapse of interest in statistical graphics, as concern with formal, ``precise'', and
numerical methods gained ascendancy (the modern ``dark ages'' of statistical
graphics)[85].
- 1937
-
First modern review of the early history of statistical graphics- H. Gray Funkhouser (1898-1984), USA [92].
- 1939
-
Description of a memex, an associative information retrieval system which would help someone find information based in association and context rather than strict categorical indexing; conceptual creation of ``hyperlink'' and the ''World Wide Web''- Vannevar Bush (1890-1974), USA.
TXT: Bush biography (with links and images)
TXT: As We May Think (e-text):
He foresaw this operating on an electric analog computer, which was completed in 1942. His description was published in the \emph{Atlantic Monthly}, ``As We May Think'' July, 1945
- 1944
-
Harvard's Mark I, the first digital computer, put in service. Officially known as the ``IBM Automatic Sequence Controlled Calculator'' (ASCC), the Mark I was 50 feet long and weighed about 5 tons.- Howard H. Aiken (1900-1973) and Grace Hopper (1906-1992), USA.
PIC: Howard Aiken portrait (200 x 278; 33K)
IMG: The ``Mark I'' IBM ASCC (240 x 144; 38K)
TXT: Aiken biography
TXT: Howard Aiken's Harvard Mark I
TXT: History of Computing: Harvard Mark I
The first official record of the use of the word ``bug'' in the context of computing is associated with a relay-based
Harvard Mark II computer, which was in service at the Naval Weapons Center in Dahlgren, Virginia. On September 9th, 1945, a moth
flew into one of the relays and jammed it. The offending moth was taped into the log book alongside the official report, which
stated: ``First actual case of a bug being found.''
- 1944
-
Development of an electro-mechanical machine to aid in the rotation of multidimensional factor analysis solutions to ``simple
structure.'' This allowed an analyst
to carry out by direct manipulation of dials what one did by plotting
pairs of factors, and hand calculation of the rotation matrices
in earlier times [(work carried out under the Adjutant General for development of the Armed Forces General Classification Test) [289]]-
Harry Harmon (1913-1976), USA .
PIC: Harry Harmon portrait (390 x 453; 82K)