| ccmap | Produce a conditioned choropleth map | ccmap |
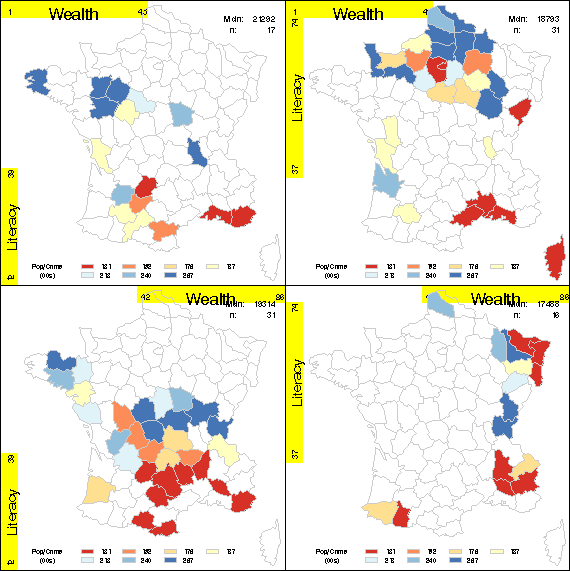
The CCMAP macro produces a set of choropleth maps for one response
variable where the geographic units are partitioned into groups
by two conditioning variables. Each region appears in all maps,
but is only shaded (in relation the the RESPONSE= variable) in those
views defined by the ranges of the conditioning (GIVEN=) variable.
This makes it possible to see how the geographic distribution of the
response changes with the conditioning variables.
See: Dan Carr's CCmaps page: http://www.galaxy.gmu.edu/~dcarr/CCmaps/ for information on CCmaps.
The CCMAP macro is defined with keyword parameters. The RESPONSE=
(or VAR=) variable is required, as are two GIVEN= variables. The ID=
variable must name the geographic region in the MAP= and DATA= data
sets.
The arguments may be listed within parentheses in any order, separated
by commas. For example:
%ccmap();
For useful results, you should also specify the MIDPOINTS= values of the
RESPONSE= variable and define a corresponding set of PATTERN statements.
MAP=MYMAPS.USVISMAP]
RESPONSE=
MAP= and DATA= data sets.
SLICES=2 2]
GIVEN= variables, in percent. Ignored if
the given variables are character. [Default: OVERLAP=0.10]
VAR= variable in the maps [Default: LEVELS=7]
VAR= variable. You should use this to
specify a common set of midpoints for the response variable
in the maps, so they all use the same midpoints. You can
append PCT to a list of numeric midpoint values to have the
macro calculate the corresponding percentiles of the VAR=
variable. Specifying MIDPOINTS= overrides the LEVELS=
parameter.
COUTLINE=GRAYCC]
LEGEND=LEGEND1. If
you do not specify LEGEND=, you will get a default PROC GMAP
legend in each map, probably not what you want.
GIVEN= variables. [Default: HSTRIP=6]
STRIPBG=YELLOW]
STRIPFG=BLACK]
GTEMP=GTEMP]
KILL=Y]
GOUT=GSEG]
NAME=CCMAP]
CCMAP requires the following macros:
  gdispla.sas     Device-independent DISPLAY/NODISPLAY control
  panels.sas      Display a set of plots in rectangular panels
  slice.sas       Divide a variable into slices
 %include macros(ccmap);        *-- or include in an autocall library;
 %include data(guerry);

 *-- Define a palette of 7 colors from Red to Blue thru Yellow;
 %brewerpal(n=7, palette=RdYlBu, out=palette);
 %genpat(data=palette, n=nobs, colors=color);

 legend1
    mode=share
    position=(bottom inside left)
    across=4
    label=(position=middle j=c 'Pop/Crime' j=c '(00s)')
    shape=bar(3,1);

 %ccmap(data=guerry, map=mymaps.gfrance(where=(density<5)),
    var=Crime_pers, given=Literacy Wealth,
    id=dept, weight=Pop1831,
    midpoints = 20 30 40 50 60 70 80 PCT,
    legend=legend1,
    slices=2 2, overlap=0.10);
