Michael Friendly's Old Home Page
This page and all related material has moved to
http://datavis.ca
These materials are maintained here only for historical purposes.
Eventually they will disappear
Please update your bookmarks and links.
Contents
If you can't find what you're looking for, you might want to try
this ht://Dig gateway I've set up to search my web.
A number of my older papers are available through the links below as compressed PostScript files (.ps.gz).
You will need WinZip, or the Gnu zip utility, gunzip to decompress them,
and a PostScript viewer
(such as GhostView) to read or print them.
 These items point to descriptions of SAS macro programs for statistical graphics related to my book,
The SAS System for Statistical Graphics, 1st Edition
and to web access to the most recent versions of these programs.
These items point to descriptions of SAS macro programs for statistical graphics related to my book,
The SAS System for Statistical Graphics, 1st Edition
and to web access to the most recent versions of these programs.
 The methods listed below (plus many more) are described in my
new book,
Visualizing Categorical Data.
See also my
Statistical Consulting Service short course, Categorical Data Analysis with Graphics .
A brief paper appears under the same title in the SAS User Group International Conference Proceedings, 1992, 17, 190-200.
The methods listed below (plus many more) are described in my
new book,
Visualizing Categorical Data.
See also my
Statistical Consulting Service short course, Categorical Data Analysis with Graphics .
A brief paper appears under the same title in the SAS User Group International Conference Proceedings, 1992, 17, 190-200.
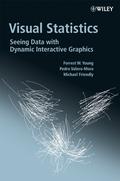 A new book, Visual Statistics:
Seeing Data with Dynamic Interactive Graphics written with Forrest W. Young and
Pedro Valero-Mora, describes a paradigm for doing statistical analysis
in a purely visual way with dynamic interactive graphics.
A new book, Visual Statistics:
Seeing Data with Dynamic Interactive Graphics written with Forrest W. Young and
Pedro Valero-Mora, describes a paradigm for doing statistical analysis
in a purely visual way with dynamic interactive graphics.
 Mosaic Displays
A mosaic display shows the frequencies in an n-way contingency table by nested rectangular regions
whose area is proportional to the frequency in a cell or marginal subtable.
The display uses color and shading to represent the sign and magnitude of standardized residuals from a specified loglinear model.
The method is described in "Mosaic displays for n-way contingency tables",Journal of the American Statistical Association, 1994, 89, 190-200 and in "Mosaic displays for loglinear models", American Statistical Association, Proceedings of the Statistical Graphics Section, 1992, 61-68.
 Visual and Conceptual Models for Categorical Data
A number of graphical methods for categorical data depict cell frequencies by area or observation density. This paper describes and extends a physical, dynamic model for categorical data suggested by John Sall which provides a conceptual model for this visual representation of categorical data.
The paper appears in The American Statistician, May 1995.
There is also a related
abstract for the Conference on Visualization of
Categorical Data in Cologne, Germany, May, 1995..
 Fourfold Displays
The fourfold display is a graphic designed to display the frequencies in a 2 x 2, or 2 x 2 x K contingency table. Each cell is shown by a quarter circle, whose area is proportional to the cell count, in a way that depicts the odds ratio in each of K strata. Confidence rings for the odds ratio can be superimposed to provide a visual test of the hypothesis of no association in each stratum.
Other methods for categorical data
Most of these links are now superceded by
Visualizing Categorical Data.

APL2STAT is an implementation of an object-oriented system for statistical computation
and graphics in the APL2 language done jointly with John Fox.
The current version is implemented for IBM APL2 and the freeware TryAPL2 for PC-compatibles.
The principal ideas are described in "Using APL2 to create an object-oriented environment for statistical computation", Journal of Computational and Graphical Statistics, 1994, 3, 387-407, and
in "APL2 and APL2STAT", Sociological Methods and Research, 1995, 23, 47-56.
York University Statistical Consulting Service
Other Links
 To contact me
-
 E-mail
 Voice: (416) 736-5115 x66249; Fax: (416) 736 5814
 Michael Friendly,
Psychology Department
Michael Friendly,
Psychology Department
York University,
4700 Keele Street,
Toronto ONT Canada M3J 1P3
URL: http://www.math.yorku.ca/SCS/friendly.html