SAS Macro Programs: cqplot
$Version: 1.2 (09 Dec 2003)
Michael Friendly
York University
The cqplot macro produces quantile-quantile comparison plots for
multivariate normal data (based on squared Mahalanobis distances
from the centroid) or for any other data which
should follow a Chi-square distribution, together with
estimated confidence bands.
For p variables and a large sample size, the squared Mahalanobis
distances of the observations to the mean vector are distributed as
chi-square with p degrees of freedom when the data has a multivariate
normal distribution.
However, the sample size
must be quite large for the chi-square distribution to obtain
unless p is very small. Also, this plot is sensitive to the
presence of outliers. So, this plot should be cautiously used as a
rough indicator of multivariate normality.
The macro produces either printer plots or high-resolution plots,
or both.
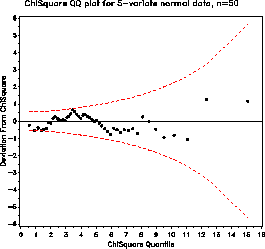
In addition, the macro can plot a detrended version, in which the
vertical axis shows the difference between the data value and the
expected Chi-square value.
Method
Confidence intervals for the Chi-square QQ plot are based on
standard error formulas given by
J. Chambers et al. Graphical methods for data analysis,
1983.
Usage
cqplot is a macro program. Values must be supplied for the VAR=
variables, or supply a value for the DSQ= parameter.
%cqplot(data=inputdataset, var=inputvariables, ..., )
- DATA=_LAST_
- The name of the input dataset. If not specified, the most
recently created dataset is used.
- VAR=
- Names of the variables whose squared distances are
to be plotted
- ID=
- The name of an ID variable, used to label observations
which fall outside the upper confidence band.
- NVAR=
- The number of variables in the VAR= list
- DSQ=
- If the input dataset already contains a chi-square
variable to be plotted, specify the name of this variable as the
DSQ= parameter.
- PPLOT=NO
- Produce printer plots?
- GPLOT=YES
- Produce Hi-res (SAS/GRAPH) plots?
- OUT=cqplot
- Name of the output data set
- STDERR=YES
- plot std errors around curves?
- STDMULT=2
- Multiplier of the standard error used for confidence
bands.
- DETREND=YES
- plot detrended version?
- LH=1.5
- height for axis labels
- ANNO=
- The name of an optional input annotate data set
which can be used to add graphical information (observation labels, etc.)
to the QQ plot.
- ANNOD=
- The name of an optional input annotate data set
which can be used to add graphical information (observation labels, etc.)
to the detrended QQ plot.
- NAME=CQPLOT
- The name of graphic catalog entries
- GOUT=
- The name of graphic catalog in which hi-res plots
are stored.
Example
This example generates random 5-variate data from a multivariate normal
distribution.
%let dist=normal;
%let nobs=50;
%let nvar=5;

title "ChiSquare QQ plot for &nvar-variate &dist data, n=&nobs";
data cqtest;
   drop i;
   do i=1 to &nobs;
      x1 = &dist(123425535);
      x2 = &dist(123425535) + x1;
      x3 = &dist(123425535) + x1 - x2;
      x4 = &dist(123425535) - x1 + x2;
      x5 = &dist(123425535) - x1 + x2 + x3;
      output;
      end;
The cqplot macro plots the squared distances of each observation from
the centroid.
%cqplot(data=cqtest, var=x1-x5, nvar=5);
The macro call produces these two plots:

 You can see what happens with non-normal data by
changing the line
%let dist=normal;
to
%let dist=uniform; /* Uniform distribution */
or
%let dist=rancau; /* Cauchy distribution */
See also
nqplot Normal QQ plot
normplot
outlier Robust multivariate outlier detection

