SAS Macro Programs: symbox
$Version: 1.2 (22 Oct 2003)
Michael Friendly
York University
Boxplots for transformations to symmetry
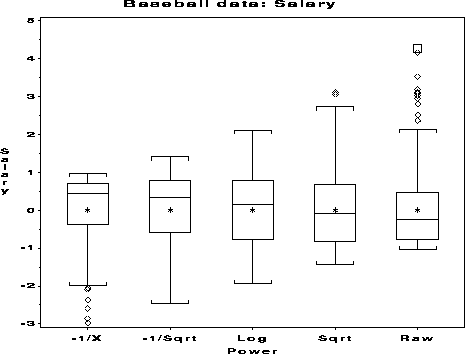
Various graphical displays for diagnosing symmetry of a distribution
are available in the SYMPLOT macro. SYMBOX takes a more direct approach.
The variable is first transformed to each of a series of selected powers,
then each transform is standardized to mean=0, std=1.
The results are then displayed side-by-side in boxplots, permiting
a visual assessment of which power makes the distribution reasonably
symmetric.
Missing and non-positive observations are excluded.
Parameters
- DATA=_LAST_
- Name of the input data to be analyzed.
- VAR=
- Name of the variable to be plotted. Only
one variable may be specified.
- POWERS=0 .5 1
- A list of two or more powers for the VAR= variable
to be transformed. A power of 0 is taken to mean 'log10(VAR)'.
Negative powers are taken to mean '-1 / VAR**|power|'.
- OUT=SYMOUT
- Name of the output data set
- NAME=SYMBOX
- The name assigned to the graph(s) in the
graphic catalog.
Example
This example examines the distribution of the variable SALARY in the
Baseball dataset.
%include data(baseball);

title h=1.6 "Baseball data: Salary";
%symbox(data=baseball, var=Salary, powers =-1 -.5 0 .5 1 );

See also
boxcox Power transformations by Box-Cox method
boxplot Box-and-whisker plots
stars Diagnostic plots for transformations to symmetry
