SAS Macro Programs: boxcox
$Version: 1.4 (21 Aug 2002)
Michael Friendly
York University
Power transformations by Box-Cox method
The boxcox macro finds maximum likelihood power
(or folded power) transformations of
the response variable in a regression model by the Box-Cox method.
The program provides
graphic displays of the maximum likelihood solution, t-values
for model effects, and the influence of observations on choice of
power. The program can produce
printer plots or high-resolution versions of any of these plots.
The optimal transformation of the response variable is returned
in an output dataset.
For a positive response variable, y > 0, the family of monotone
power transformations with power p is
| y(p) =
|
(yp - 1) / p |
p != 0 |
| log (y) |
p = 0 |
If the response contains 0 or negative values, use the ADD= parameter
to assure that y+&ADD is strictly positive.
If the response variable is bounded on a closed interval, [0, b],
the FOLD= parameter may be used to obtain analogous folded-power
transformations. For example, use FOLD=100 when the response
variable is a percentage on the interval [0, 100].
Method
The program uses transforms the response to all powers from
the LOPOWER= value to the HIPOWER= value, and fits a regression
model for each, extracting values to an output dataset from
which the plots are drawn.
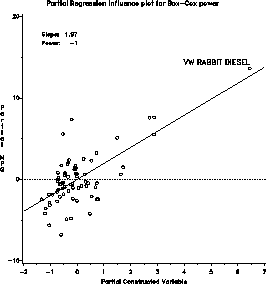
The influence plot also implements a score test for the power transformation
due to Atkinson, which provides an alternative estimate of the
power transformation, based on power = 1 - slope of the fitted line
in the partial regression plot for a constructed variable.
Usage
boxcox is a macro program. A value must be supplied for the
RESP= parameter.
The arguments may be listed within parentheses in any order, separated
by commas. For example:
%boxcox(resp=responsevariable, model=predictors, ..., )
Parameters
- RESP=
- The name of the response variable for
analysis.
- MODEL=
- A blank-separated list of the independent variables in the
regression, i.e., the terms on the right side
of the = sign in the MODEL statement for PROC
REG. The MODEL= terms may be empty to obtain a
transformation of a response on its own.
- DATA=_LAST_
- The name of the data set holding the
response and predictor variables. (Default:
most recently created)
- ID=
- The name of an ID variable for observations,
used in labeling the influence plot. (Default: ID=_N_)
- FOLD=0
- Upper bound for the response variable. If
FOLD>0 is specified, folded power transformations are computed.
E.g., for a response which is a proprotion, specify FOLD=1;
for a percentage, specify FOLD=100.
- OUT=_DATA_
- The name of an output dataset to contain
the transformed response. This dataset
contains all original variables, with the
transformed response replacing the original
variable.
- OUTPLOT=_PLOT_
- The name of the output data set containing
_RMSE_, and t-values for each effect in the
model, with one observation for each power
value tried.
- PPLOT=RMSE EFFECT INFL
- Which printer plots should be produced?
One or more of RMSE, EFFECT, and INFL, or NONE.
- GPLOT=RMSE EFFECT INFL
- Which high-resolution (PROC GPLOT) plots
should be produced? One or more of RMSE,
EFFECT, and INFL, or NONE.
- LOPOWER=-2
- low value for power
- HIPOWER=2
- high value for power
- NPOWER=21
- number of power values in the interval
LOPOWER to HIPOWER
- CONF=.95
- confidence coefficient for the confidence
interval for the power.
Example
The example finds power transformations for the MPG variable
in the auto dataset, using Weight, Displacement and Gear Ratio
as predictors.
%include data(auto);
%include macros(boxcox);     * or, store in autocall library;
%boxcox(data=auto,
         resp=MPG,
         model=Weight Displa Gratio,
         id=model,
         gplot=RMSE EFFECT INFL,
         lopower=-2.5, hipower=2.5, conf=.99);
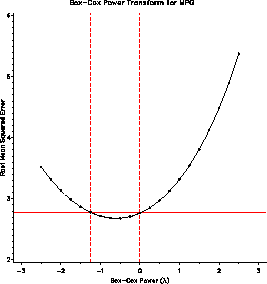
The plot of RMSE vs. lambda (power) indicates power = -1 / sqrt(MPG)
as the maximum likelihood estimate, but power = -1 / MPG == gallons/mile
is within the confidence interval.
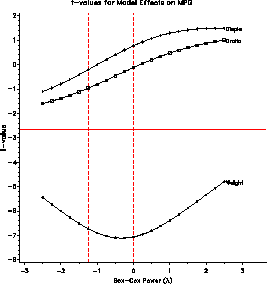
The EFFECT plot indicates that the significance of partial t-test are unaffected by the choice of power.
The influence plot indicates that the VW Diesel has a large leverage,
but is not influential in determining the choice of power.


See also
boxglm Power transformations by Box-Cox method for GLM
boxtid Power transformations by Box-Tidwell method
nqplot Normal QQ plot
outlier Robust multivariate outlier detection
resline Resistant line for bivariate data
stars Diagnostic plots for transformations to symmetry


