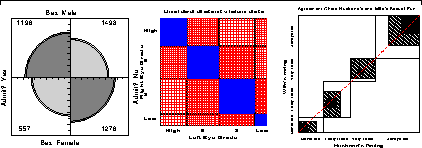
The analysis of two-way frequency tables concerns the association between two variables. Different specialized displays are focused on visualizing an odds ratio (2 x 2 tables), or the general pattern of association, or the agreement between row and column categories.
- 3.1. Introduction
- 3.2. Tests of association for two-way tables
- 3.2.1. Notation and terminology
- 3.2.2. 2 by 2 tables
- 3.2.3. Larger tables---Overall analysis
- 3.2.4. Tests for ordinal variables
- 3.2.5. Sample CMH Profiles
- 3.2.2. 2 by 2 tables
- 3.3. Stratified analysis
- 3.3.1. Assessing homogeneity of association
- 3.4. Fourfold display for 2 x 2 tables
- 3.4.1. Confidence rings for odds ratio
- 3.4.2. The FOURFOLD program
- 3.4.3. Stratified analysis for 2 x 2 x k tables
- Example 3.XX: Toxaemic symptoms in pregnancy
- 3.4.2. The FOURFOLD program
- 3.5. Sieve diagrams
- 3.5.1. The SIEVE program
- 3.5.2. Larger tables
- 3.6. Association plots
- 3.7. Observer agreement
- 3.7.1. Measuring agreement
- 3.7.2. Observer Agreement Chart
- 3.7.3. Observer bias
- 3.7.4. The AGREE program
- 3.7.2. Observer Agreement Chart
- 3.8. Trilinear plots
- 3.9. Chapter summary
- 3.2. Tests of association for two-way tables