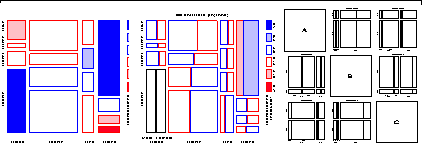
Mosaic displays help to visualize the pattern of associations among variables in two-way and larger tables. Extensions of this technique can reveal partial associations, marginal associations, and shed light on the structure of loglinear models themselves.
- 4.1. Introduction
- 4.2. Two-way tables
- 4.2.1. Software for mosaic displays
- 4.3. Three-way tables
- 4.3.1. Fitting models
- 4.3.2. Causal models
- 4.3.3. Partial association
- 4.3.2. Causal models
- 4.4. Mosaic Matrices for Categorical Data
- 4.4.1. Conditional mosaic matrices
- 4.5. Showing the structure of loglinear models}
- 4.5.1. Mutual independence
- 4.5.2. Joint independence
- 4.5.3. Conditional independence
- 4.5.2. Joint independence
- 4.6. Chapter summary
- 4.2. Two-way tables