SAS Macro Programs: alleff
$Version: 1.2 (08 Feb 2006)
Michael Friendly
York University
All-effects plot for a factorial ANOVA design
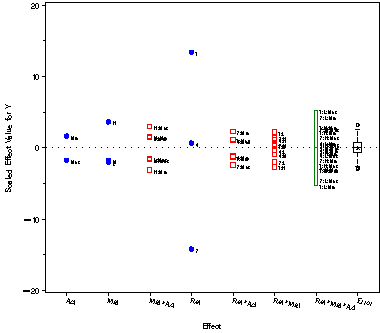
The ALLEFF macro constructs a side-by-side plot of the values of
main effects, interactions, and residuals for any linear model,
as described in SSSG, Section 7.4.3, and Hoaglin et al. (1991),
`Fundamentals of Exploratory Analysis of Variance', Wiley.
The goal is to display the effect values for the levels of all
main effects and interactions, together with the values of residuals
(whose mean square is the MSE) in a single comprehensive display.
The ALLEFF macro is defined with keyword parameters. The RESPONSE=
and MODEL= parameters are required. The arguments may be listed
within parentheses in any order, separated by commas. For example:
%alleff(data=rats, response=gain, model=amount feed amount*feed);
- DATA=
-
The name of the input data set [Default:
DATA=_LAST_]
- RESPONSE=
-
The name of the response variable in the model
- MODEL=
-
A blank-separated list of terms in a MODEL statement for GLM. In
this version, all model variables are treated as CLASS
variables, and the terms in the model may not use GLM '|' notation.
That is, a two-way factorial design should be specified
as
MODEL=A B A*B, rather than A|B.
- PRINT=
-
Things to print: Any one or more of DESIGN FIT EFFECT LABEL
- SCALE=
-
If non-blank, the effect values are scaled by sqrt(n/df),
so that their values are comparable as mean squares. Use
SCALE=1 when the goal is to see the size of the effects
in relation to the size of the MSE. [This should probably
be the default, but is not.]
- VAXIS=
-
AXIS statement for vertical axis. If not specified,
the program uses
AXIS1 LABEL=(A=90) and VAXIS=AXIS1.
- HAXIS=
-
AXIS statement for horizontal axis. If not specified,
the program uses
AXIS2 OFFSET=(4) and HAXIS=AXIS2. For 3+
factors, it also uses VALUE=(A=-20) to allow longer effect labels to
fit on the horizontal axis.
- HTEXT=
-
Height of text labels for effects. If not specified, the
global HTEXT goption is used.
- SYMBOLS=
-
A list of SAS/Graph symbols to be used for 1-factor (main)
effects, 2-factor effects, 3-factor effects, ...
There should be as many symbols as factors in the design.
Using the defaults for
SYMBOLS=, COLORS= and INTERP= causes
the program to generate the following SYMBOL statements:
-
  symbol1 value=dot color=blue interpol=none h=1.5;
  symbol2 value=square color=red interpol=hilob h=1.5;
  symbol3 value=none color=green interpol=hilob h=1.5;
  symbol4 v=none i=none c=black;
-
Alternatively, you can define your own SYMBOL statements,
SYMBOL1, SYMBOL2, ... before calling ALLEFF and specify
SYMBOLS=SYMB. In this case, no SYMBOL statements are
generated internally. [Default: SYMBOLS=DOT SQUARE NONE]
- COLORS=
-
A list of SAS/Graph colors to be used for 1-factor (main)
effects, 2-factor effects, 3-factor effects, ... of length
equal to the number of factors. Ignored if
SYMBOLS=SYMB.
[Default: COLORS=BLUE RED GREEN]
- INTERP=
-
A list of SAS/Graph interpolation options to be used for 1-factor (main)
effects, 2-factor effects, 3-factor effects, ... of length
equal to the number of factors. Ignored if
SYMBOLS=SYMB.
[Default: INTERP=NONE NONE HILOB]
- HSYM=
-
Height of symbols in generated SYMBOL statements. Ignored if
SYMBOLS=SYMB.
[Default: HSYM=1.5]
- RESIDS=
-
Specifies how to display the residuals in the plot. At present,
only
RESIDS=BOXAXIS is recognized, which causes the program to use
the BOXAXIS macro to draw a boxplot of residuals after the final model
effect.
- OUTFIT=
-
Output data set containing effect values as columns.
The effect values are named by abbreviating the model
variables to 1 or 2 characters. [Default:
OUTFIT=OUTFIT]
- OUTEFF=
-
Output data set containing effect values in the form used
for the plot.
- NAME=
-
Name for the graphics catalog entry. [Default:
NAME=ALLEFF]
- GOUT=
-
Name for the graphics catalog used to store the plot. [Default:
GOUT=GSEG]
SAS/IML
boxaxis Annotate an axis with a univariate boxplot
boxanno Annotate a scatter plot with univariate boxplots
combine Combine the values of two or more variables
expglm (experimental)
- Only handles fully crossed designs, though not all terms need be included
in the model.
- All model terms are treated as CLASS variables. Under SAS V <7, there
is a limit of 4 factors.
- Should incorporate the necessary macro code to construct the design
matrix directly, rather than relying on IML routines from desmat.sas.
(use GLMMOD)
-
Jack Hamilton and Ian Whitlock helped solve some thorny problems
in manipulating the effect data into the form required for plotting.
-
John Hendrickx provided the %DESMAT macro and supporting IML routines.
Example
The RECALL data, on long term memory of nonsense syllables
as a function of Retention interval, type of Material (L, M, H
meaningfulness), and nature of the intervining Activity.
%include macros(alleff);        *-- or include in an autocall library;
%include data(recall);
proc format;
   value Afm 1='1'   4='4'    7='7';  /* retention */
   value Bfm 1='L'   2='M'    3='H' ; /* material */
   value Cfm 1='Min' 2='Max';         /* activity */
*-- Create formatted values;
data recall;
	set recall;
	Ret = put(A, Afm.);
	Mat = put(B, Bfm.);
	Act = put(C, Cfm.);

axis2 offset=(4) value=(a=-10 h=1.5);
%alleff(data=recall,
    response=Y,
    model=Ret Mat Act Ret*Mat Ret*Act Mat*Act Ret*Mat*Act,
    haxis=axis2,
    print=label effect,
    scale=1,
    htext=1);
Output:

See also
boxanno Annotate a scatter plot with univariate boxplots
expglm Expand a GLM model specification from bar notation
hovplot Boxplot display of homogeneity of variance tests
meanplot Plot means for factorial designs
twoway Diagnostic plots for two-way tables
