| boxglm |
Power transformations by Box-Cox method for GLMs |
boxglm |
SAS Macro Programs: boxglm
$Version: 1.1 (10 Dec 1991)
Michael Friendly
York University
Power transformations by Box-Cox method for GLMs
The boxglm macro finds power transformations of the response variable in a
general linear model by the Box-Cox method, with graphic display of the
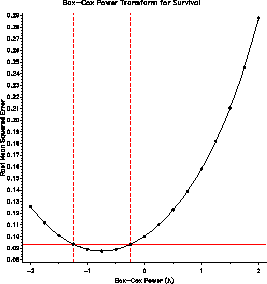
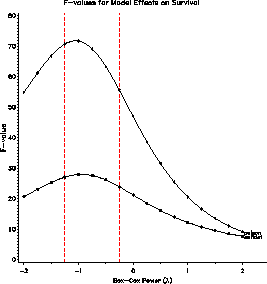
maximum likelihood solution (RMSE plot), F-values for model effects (EFFECT
plot), and the
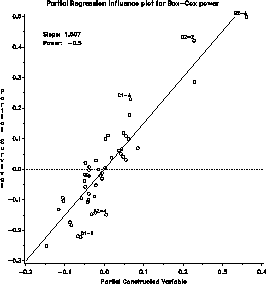
influence of observations on choice of power (INFL plot). The program produces
printer plots by default, and can optionally produce
high-resolution versions of any of these plots.
Method
The program uses transforms the response to all powers from
the LOPOWER= value to the HIPOWER= value, and fits a linear
model using PROC GLM for each, extracting values to an output dataset from
which the plots are drawn.
The influence plot also implements a score test for the power transformation
due to Atkinson, which provides an alternative estimate of the
power transformation. based on power = 1 - slope of the fitted line
in the partial regression plot for a constructed variable.
Usage
boxglm is a macro program. Values must be supplied for the
RESP= and MODEL= parameters.
The arguments may be listed within parentheses in any order, separated
by commas. For example:
%boxglm(resp=responsevariable, model=predictors, ..., )
Parameters
- RESP=
- The name of the response variable for
analysis.
- MODEL=
- The independent variables in the
model, i.e., the terms on the right side
of the = sign in the MODEL statement for PROC
GLM. The MODEL= argument should be spelled out
completely, rather than using abbreviated 'bar'
notation.
- CLASS=
- Specifies the MODEL= variables which are
classification factors rather than continuous variables.
- DATA=_LAST_
- The name of the data set holding the
response and predictor variables. (Default:
most recently created)
- ID=
- The name of an ID variable for observations
- OUT=_DATA_
- The name of an output dataset to contain
the transformed response. This dataset
contains all original variables, with the
transformed response replacing the original
variable.
- OUTPLOT=_PLOT_
- The name of the output data set containing
_RMSE_, and t-values for each effect in the
model, with one observation for each power
value tried.
PPLOT=RMSE EFFECT INFL
- Which printer plots should be produced?
One or more of RMSE, EFFECT, and INFL, or NONE.
- GPLOT=NONE
- Which high-resolution (PROC GPLOT) plots
should be produced? One or more of RMSE,
EFFECT, and INFL, or NONE.
- LOPOWER=-2
- low value for power
- HIPOWER=2
- high value for power
- NPOWER=21
- number of power values in the interval
LOPOWER to HIPOWER
- CONF=.95
- confidence coefficient for the confidence
interval for the power.
Example
The example finds power transformations for the SURVIVAL variable
in a dataset relating survival time to
type of poison and antidote used.
data poisons;
   input antidote $ poison @;
   label survival='Survival time';
   length id $4;
   do rep = 1 to 4;
      id = trim(antidote)||trim(put(poison,1.))||'-'||put(rep,1.);
      input survival @;
      output;
      end;
cards;
A 1  .31  .45  .46  .43
A 2  .36  .29  .40  .23
A 3  .22  .21  .18  .23
B 1  .82 1.10  .88  .72
B 2  .92  .61  .49 1.24
B 3  .30  .37  .38  .29
C 1  .43  .45  .63  .76
C 2  .44  .35  .31  .40
C 3  .23  .25  .24  .22
D 1  .45  .71  .66  .62
D 2  .56 1.02  .71  .38
D 3  .30  .36  .31  .33
;
*include macros(boxglm);
%boxglm(data=poisons,
        resp=Survival,
        model=antidote poison,
        class=antidote poison,
		  id=id,
        gplot=RMSE EFFECT INFL,
        npower=17, conf=.99);
The plot of RMSE vs. lambda (power) indicates power = -1 / sqrt(SURVIVAL)
as the maximum likelihood estimate, but power = -1 / SURVIVAL == survival
rate is within the confidence interval.
The EFFECT plot indicates that the significance of partial F-tests are unaffected by the choice of power.
The influence plot indicates that a few observations have a large leverage,
but none is influential in determining the choice of power.


See also
boxcox Power transformations by Box-Cox method
boxtid Power transformations by Box-Tidwell method
outlier Robust multivariate outlier detection
resline Resistant line for bivariate data
stars Diagnostic plots for transformations to symmetry


