SAS Macro Programs: boxtid
$Version: 1.2 (31 Jul 2000)
Michael Friendly
York University
Power transformations by Box-Tidwell method
The BOXTID macro finds power transformations for some or all of the
predictors in a regression model using the Box-Tidwell method. In addition,
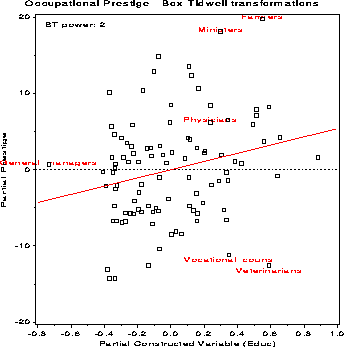
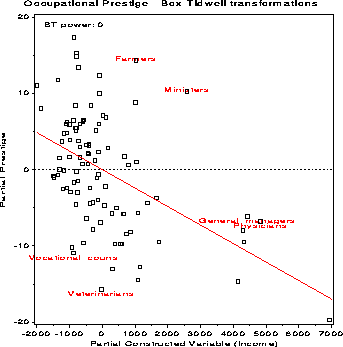
it can produce plots showing the influence of individual observations on
the selection of powers. These are partial residual plots for the
constructed variables X * log X.
Observations with
large studentized residuals or large Cook's distances are labeled
automatically using the ID= variable.
As a convenience, an output data set containing the optimally transformed
variables is also produced.
The BOXTID macro takes 14 keyword arguments. You must specify either the RESP= or YVAR= parameter, and the names of all predictors (XVAR=). For example:
  %boxtid(data=angell, yvar=moralint,
       xvar=hetero mobility, id=city);
Default values are shown after the parameter name.
- DATA=_last_
-
Name of input data set
- RESP=
-
The name of the response variable
- YVAR=
-
Response variable (synonym for RESP=)
- XVAR=
-
Names of the predictors in the model. This must be a simple list of
variable names, i.e., lists like
X1-X10 are not allowed.
- XTRANS=
-
Variables to be transformed: names or indices. If
XVAR=X1 X2 X3 X7 X9, you may specify either
XTRANS=X3 X7 X9 or XTRANS=3 4 5 for the same effect. If not specified, all variables in the XVAR= list are transformed.
- PREFIX=T_
-
Prefix for names of transformed variables. If the X variables are X1 X2 X3,
the output data set will contain T_X1, T_X2, T_X3 when the
PREFIX=T_.
- ID=
-
Name of an ID variable, used as a point label in plots.
- OUT=boxtid
-
Name of output data set
- ROUND=0.5
-
Round powers. The estimated power for each predictor is rounded to the
nearest ROUND= unit in constructing the transformed variables.
- MAXIT=15
-
Maximum number of iterations
- CONVERGE=0.001
-
Convergence criterion. The process stops when the largest change in an
estimated power is less than the CONVERGE= value, or when MAXIT iterations would be exceeded.
- PPLOT=
-
Specifies printer plots, if any to be produced. Either or both of the
keywords TRANS and INFL.
- GPLOT=INFL
-
Specifies high-res influence plots.
- QUIET=N
-
Y or N.
QUIET=Y suppresses printout of the iteration history.
Example
The example below finds power transformations of the variables
Income and Education in a model predicting occupational
prestige for these variables, plus linear and quadratic
terms in Women (% of women in an occupational category).
%include macros(boxtid);        *-- or include in an autocall library;
goptions hsize=6.5in vsize=6.5in;

title 'Occupational Prestige - Box-Tidwell transformations';
%include data(prestige);

data prestige;
   set prestige;
   women2 = women**2;
   run;

%boxtid(data=prestige,
   yvar=Prestige,
   xvar=Women Women2 Educ Income,
   xtrans=Educ Income,      /* vars to xform: educ income,     */
   id=job,
   out=boxtid);
The procedure indicates that the model should include Educ2
and log(Income).
The influence plots are shown below.
Observations with
large studentized residuals or large Cook's distances are labeled
automatically.


The relationship of the transformed variables to Prestige
may be seen by plotting the T_ variables against Prestige
from the output dataset,
with a smoothed lowess curve.
%lowess(data=boxtid, x=t_income, y=prestige, id=job,
        f=.667, plot=YES, colors=blue red, interp=rl);

%lowess(data=boxtid, x=t_educ, y=prestige, id=job,
        f=.667, plot=YES, colors=blue red, interp=rl);
See also
boxcox Power transformations by Box-Cox method
boxglm Power transformations by Box-Cox method for GLM
lowess Locally weighted scatterplot smoother
resline Resistant line for bivariate data
sprdplot Spread-Level plot to find transformation to equalize variances.
symbox Boxplots for transformations to symmetry

