SAS Macro Programs for Statistical Graphics: SCATMAT
$Version: 1.7 (02 Nov 2006)
Michael Friendly
York University
The SCATMAT macro draws a scatterplot matrix for all pairs of
variables specified in the VAR= parameter. The program will not do
more than 10 variables. You could easily extend this, but the
plots would most likely be too small to see.
If a classification variable is specified with the GROUP=
parameter, the value of that variable determines the shape and
color of the plotting symbol. The macro GENSYM defines the SYMBOL
statements for the different groups, which are assigned according
to the sorted value of the grouping variable. The default values
for the SYMBOLS= and COLORS= parameters allow for up to eight
different plotting symbols and colors. If no GROUP= variable is
specified, all observations are plotted using the first symbol and
color.
Dependencies
Depending on options selected, the SCATMAT macro calls several
other macros not included here. It is assumed these are stored
in an autocall library. If not, you'll have to %include each one
you use.
| Macro | Function | Needed |
|---|
| %gdispla | device-independent DISPLAY control | always |
| %lowess | smoothed lowess curves | ANNO = ... LOWESS |
| %ellipses | data ellipses | ANNO = ... ELLIPSE |
| %boxaxis | boxplot for diagonal panels | ANNO = ... BOX |
Parameters
- DATA=_LAST_
- Name of the data set to be plotted.
- VAR=
- List of variables to be plotted. The VAR=
variables may be specified as a list of blank-separated names,
or as a range of variables in the form X1-X4 or VARA--VARB.
- GROUP=
- Name of an optional grouping variable used
to define the plot symbols and colors.
- INTERP=NONE
- SYMBOL statement interpolation option.
Specifying INTERP=RL gives a fitted linear
regression line in each scatterplot.
- ANNO=NONE
- Provides additional annotations to the diagonal
and/or off-diagonal panels of the scatterplot matrix.
You can specify one or more of the keywords BOX, ELLIPSE,
and LOWESS
- BOX - draws a boxplot showing the distribution of each variable
in the diagonal panel for that variable.
Requires the boxaxis macro
- ELLIPSE - draws a data ellipse
in each off-diagonal panel.
Requires the ellipses macro
- LOWESS - draws a smoothed lowess curve
in each off-diagonal panel.
Requires the lowess macro
- SYMBOLS=%str(circle + : $ = X _ Y)
- List of symbols, separated by spaces, to
use for plotting points in each of the groups.
The i-th element of SYMBOLS is used for
group i. If there are more groups than
symbols, the available values are reused cyclically.
- COLORS=BLACK RED GREEN BLUE BROWN YELLOW ORANGE PURPLE
- List of colors to use for each of the
groups. If there are g groups,
specify g colors. The i-th
element of COLORS is used for group i.
If there are more groups than
colors, the available values are reused cyclically.
- NAME=scatmat
- Name of the graphic catalog entry
- GOUT=GSEG
- Name of the graphics catalog used to store
the final scatterplot matrix constructed by
PROC GREPLAY. The individual plots are stored
in WORK.GSEG.
Example
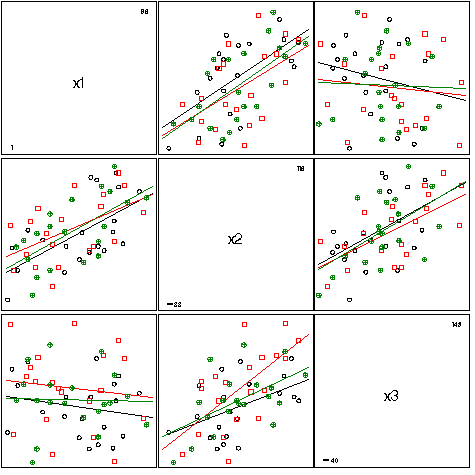
Generate some random, correlated data, and show the scatterplots
with separate regression lines for each group:
%include macros(scatmat);
data test;
  do i=1 to 60;
     gp = 1 + mod(i,3);
     x1 = round( 100*uniform(12315));
     x2 = round( 100*uniform(12315)) + x1 - 50;
     x3 = round( 100*uniform(12315)) - x1 + x2;
     x4 = round( 100*uniform(12315)) + x1 - x3;
     output;
     end;

%scatmat(data=test, var=x1-x3, group=gp, interp=rl);

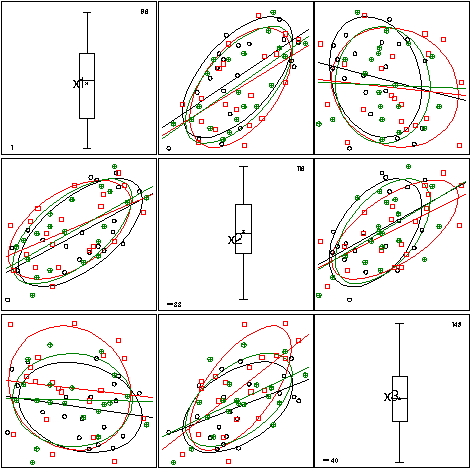
Show the same data with marginal boxplots, and data ellipses:
%scatmat(data=test, var=x1-x3, group=gp, interp=rl, anno=BOX ELLIPSE);


