| ellipses | Plot bivariate data ellipses | ellipses |
The ELLIPSES macro plots a bivariate scatterplot with a bivariate data ellipse for one or more groups. This macro was renamed from contour.sas
The ELLIPSES macro is defined with keyword parameters. The X= and Y=
variables are required.
The arguments may be listed within parentheses in any order, separated
by commas. For example:
%ellipses(data=auto, x=price, y=weight);
DATA=_LAST_]
X= and Y= separately, you can specify
the names of the variables with the VAR= parameter.
GROUP= variable is
specified, one ellipse is produced for each value of this
variable in the data set. If no GROUP= variable is specified,
a single ellipse is drawn for the entire sample.
The GROUP= variable may be character or numeric.
GROUP=
PVALUE=.5 .9), in which case one ellipse is generated
for each value. [Default: PVALUE=0.68]
style(s) for ellipse [Default: LINE=5]
width(s) for ellipse [Default: WIDTH=1]
ANNOADD=MEAN GPLABEL]
STD=STDERR gives error
bars equal to each mean +- one standard error for both
variables. STD=STD gives error bars whose
length is one standard deviation for both variables.
[Default: STD=STDERR]
POINTS=40]
GROUP= variable,
ALL=YES just draws the ellipse twice. [Default: ALL=NO]
OUT=ELLIPSES]
PLOT=YES, the macro plots the data together
with the generated ellipses. Otherwise, only the output
Annotate data set is generated.[Default: PLOT=YES]
I=RL to include the
regression line, I=RQ to draw a quadratic, etc. [Default: I=NONE]
I=)
ALL=NO, and g + 1 colors if ALL=YES.
The colors specified are recycled as needed.
[Default: COLORS=RED BLUE GREEN BLACK PURPLE BROWN ORANGE YELLOW ]
SYMBOLS=DOT SQUARE CIRCLE + STAR -     PLUS   :      $
		  =
]
HSYM=1.2]
HTEXT=1.5]
NAME=ELLIPSES]
GOUT=GSEG]
 %include macros(ellipses);        *-- or include in an autocall library;
 %include data(auto) ;
 %ellipses(data=auto,
          x=price, y=weight, group=origin,
          pvalue=.5);
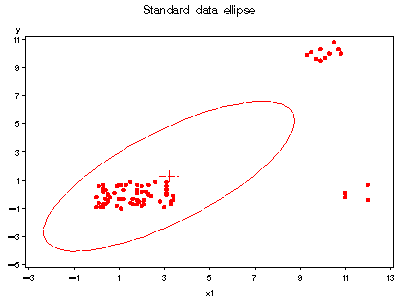
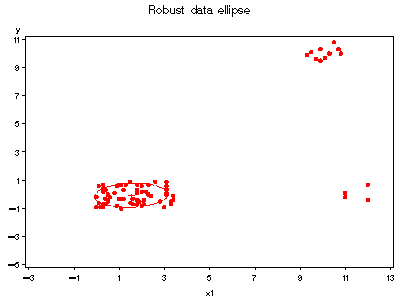
Robust data ellipses may be obtained by first using the ROBUST macro,
then feeding the output dataset to ELLIPSES, specifying WEIGHT=WEIGHT.
%include data(hawkins);
%robcov(data=hawkins, var=x1-x3 y, id=case, outc=robcov, out=hawkinsr);

axis1 order=(-5 to 11 by 2);
axis2 order=(-3 to 13 by 2);
title 'Standard data ellipse';
%ellipses(data=hawkinsr, y=y, x=x1, vaxis=axis1, haxis=axis2);
%gskip;

title 'Robust data ellipse';
%ellipses(data=hawkinsr, y=y, x=x1, weight=weight, vaxis=axis1, haxis=axis2);

