Visualizing Categorical Data: inflogis
$Version: 1.3 (24 May 2000)
Michael Friendly
York University
Influence plot for logistic regression models
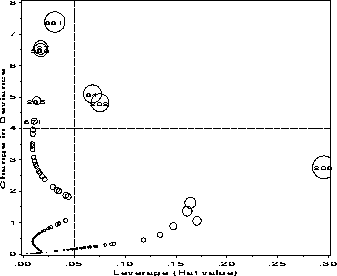
The INFLOGIS macro produces influence plots for a logistic regression
model. The plot shows a measure of badness of fit for a given case (DIFDEV
or DIFCHISQ) vs. the fitted probability (PRED) or leverage (HAT), using an
influence measure (C or CBAR) as the size of a bubble symbol.
The INFLOGIS macro is called with keyword parameters. The arguments may be
listed within parentheses in any order, separated by commas. For example:
%inflogis(data=icu, y=died, x=age cancer uncons admit, id=id, gx=hat);
- DATA=
-
Specifies the name of the input data set to be analyzed. [Default:
DATA=_LAST_]
- Y=
-
Name of the response variable
- TRIALS=
-
Name of trials variable (for event/trials syntax)
- X=
-
Names of predictors
- ID=
-
Name of observation ID variable (char)
- OUT=
-
Name of the output data set [Default:
OUT=_DIAG_]
- GY=
-
Ordinate for plot: DIFDEV or DIFCHISQ [Default:
GY=DIFDEV]
- GX=
-
Abscissa for plot: PRED or HAT [Default:
GX=PRED]
- BUBBLE=
-
Bubble proportional to: C or CBAR [Default:
BUBBLE=C]
- LABEL=
-
Points to label: ALL, NONE, or INFL [Default:
LABEL=INFL]
- DEV=
-
DIFDEV/DIFCHISQ criterion for influential points [Default:
DEV=4]
- LSIZE=
-
Observation label size. The height of other text is controlled by the
HTEXT= goption. [Default: LSIZE=1.5]
- LCOLOR=
-
Observation label color [Default:
LCOLOR=BLACK]
- LPOS=
-
Observation label position [Default:
LPOS=5]
- BSIZE=
-
Bubble size scale factor [Default:
BSIZE=10]
- BSCALE=
-
Bubble size proportional to AREA or RADIUS [Default:
BSCALE=AREA]
- BCOLOR=
-
Bubble color [Default:
BCOLOR=BLACK]
- REFCOL=
-
Color of reference lines [Default:
REFCOL=BLACK]
- REFLIN=
-
Line style for reference lines; 0->NONE [Default:
REFLIN=33]
- LOPTIONS=
-
Options for PROC LOGISTIC [Default:
LOPTIONS=NOPRINT]
- NAME=
-
Name of the graph in the graphic catalog [Default:
NAME=INFLOGIS]
- GOUT=
-
Name of the graphics catalog
Example
Plot change in deviance (DIFDEV) against hat value (HAT) for the ICU data:
%include vcd(inflogis);        *-- or include in an autocall library;
%include data(icu);

%inflogis(data=icu, y=died, x=age  cancer  uncons admit, id=id, gx=hat);

See also
inflglim Influence plots for generalized linear models
inflplot Influence plot for regression models
![[Previous]](../icons/previous.gif)
![[Next]](../icons/next.gif)
![[Up]](../icons/up.gif)
![[Contents]](../icons/contents.gif)
![[Search]](../icons/search.gif)
Previous: inflglim Next: interact Up: Appendix A Top: index.html
