Visualizing Categorical Data: rootgram
$Version: 1.0 (9 Jan 2001)
Michael Friendly
York University
Hanging rootograms for discrete distributions
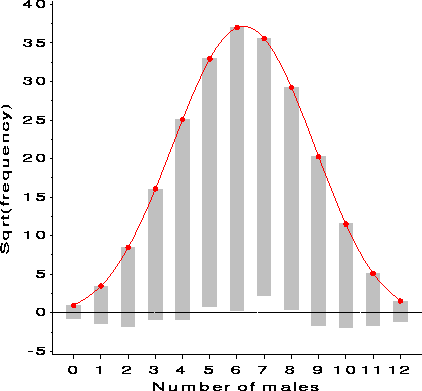
The ROOTGRAM macro produces histograms, rootograms, and hanging rootograms
for the distribution of a discrete variable compared with expected
frequencies according to a theoretical distribution.
The VAR= and OBS= variables must be specified. The expected frequencies may be obtained with
the GOODFIT macro.
The ROOTGRAM macro is called with keyword parameters. The arguments may be
listed within parentheses in any order, separated by commas. For example:
  %include catdata(madison);
  %goodfit(data=madison, var=count, freq=blocks, dist=poisson);
  %rootgram(data=fit, var=count, obs=blocks);
- DATA=
-
Specifies the name of the input data set [Default:
DATA=_LAST_]
- VAR=
-
Specifies the name of the analysis variable, used as the abscissa in the
plot.
- OBS=
-
Specifies the bserved frequency variable
- EXP=
-
Expected/fitted frequency [Default:
EXP=EXP]
- FUNC=
-
The name of the function applied to ordinate. Use
FUNC=NONE
to give a plot on the scale of observed frequency. [Default: FUNC=SQRT]
- BWIDTH=
-
Bar width [Default:
BWIDTH=.5]
- BCOLOR=
-
Bar color [Default:
BCOLOR=GRAYB0]
- BTYPE=
-
Bar type: One of HANG, DEV, or NEEDLE. [Default:
BTYPE=HANG]
- ANNO=
-
The name of an input annotate dataset
- NAME=
-
Name of the graphics catalog entry
Example
%include vcd(rootgram);        *-- or include in an autocall library;
%include vcd(goodfit);         *-- or include in an autocall library;

data saxony;
	do males = 0 to 12;
		input families @;
		output;
		end;
	label males='Number of males' families='Number of families';
cards;
3  24  104  286  670  1033  1343 1112  829  478  181  45  7
;
%goodfit(data=saxony, var=males, freq=families, dist=binomial);
%rootgram(data=fit, var=males, obs=families, exp=exp);

See also
distplot Plots for discrete distributions
goodfit Goodness of fit tests for discrete distributions
ordplot Diagnose form of discrete frequency distribution
poisplot Poissonness plot for discrete distributions
![[Previous]](../icons/previous.gif)
![[Next]](../icons/next.gif)
![[Up]](../icons/up.gif)
![[Contents]](../icons/contents.gif)
![[Search]](../icons/search.gif)
Previous: robust Next: sieve Up: Appendix A Top: index.html
