SAS Macro Programs: corrgram
$Version: 1.1 (12 Sep 2003)
Michael Friendly
York University
Draw a correlogram
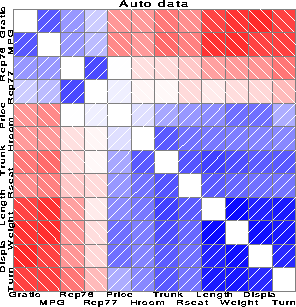
The CORRGRAM macro produces a schematic display of a correlation matrix,
called a correlogram. In this display, variables are permuted so that
``similar'' variables are positioned adjacently, and cells of a matrix are
shaded or filled to show the correlation value.
Method
Usage
The CORRGRAM macro is defined with keyword parameters. The arguments may be
listed within parentheses in any order, separated by commas. For example:
%corrgram(data=baseball, var=_numeric_, fill=C E C);
The input dataset may contain raw data (no missing values, yet), or a
correlation matrix (type='CORR') produced by PROC CORR or some other SAS
procedure.
Parameters
Default values are shown after the name of each parameter.
- DATA=
-
Name of input data set. [Default:
DATA=_LAST_]
- VAR=
-
List of variables whose correlations are to be displayed. You may use an
explicit, blank separated list of variables (the case of variable names
will be preserved), or any of the SAS abbreviations, such as
X1-X15, height--strength, or _NUMERIC_ (variable labels will apprear in upper case).
- TYPE=
-
Type of input data: DATA or CORR. If not specified, the program tries to
guess, by examining the type attribute of the input data set.
- FILL=
-
How to fill the cells in the lower triangle, diagonal and the upper
triangle. Should be three characters, chosen from
S= shade (with color proportional to the correlation), E= empty,
N= numeric value, C= circle, or B= bar [Default: FILL=S E S]
- ORDERBY=
-
PCs used to order the variables, either one or two integers (eigenvector
numbers) or empty (ORDERBY=). [Default:
ORDERBY=1 2]
- OPTIONS=
-
One or more options: RINV displays R-1 rather than R. TRANS transposes
the data set, and calculates correlations among observations, rather than
variables.
- PARTIAL=
-
List of one or more variables to be partialed out. These variables
must be included in the VAR= list.
- COLORS=
-
Colors for positive and negative values [Default:
COLORS=BLUE RED]
- HLABEL=
-
Height of variable labels
- ALABEL=
-
Angles for variable labels on the vertical and horizontal axes.
- CMIN=
-
Minimum absolute value for correlation to be shaded.
- TITLE=
-
Optional plot title, or
NONE, for no title. Under V7+, the macro uses the TITLE1 unless TITLE=NONE has been specified.
Example
These examples display correlograms for
correlations among variables on automobiles.
goptions hsize=6in vsize=6in;     *-- make plot square;

%include data(auto);
data auto;
   set auto;
   if rep77 ^= . and rep78 ^=.;       /* delete missing data         */

%include macros(corrgram);        *-- or include in an autocall library;

%corrgram(data=auto,
   var = Gratio  Turn  Rep77  Rep78  Price    MPG
   Hroom Rseat  Trunk Weight Length Displa,
   orderby=2 1,
   title=Auto data);

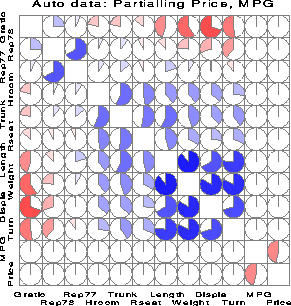
Here, we calculate and display partial correlations, partialling Price and MPG.
The values are represented by circular 'pac-man' symbols, using
the option FILL=C E C.
%corrgram(
   var = Gratio  Turn  Rep77  Rep78  Price    MPG
   Hroom Rseat  Trunk Weight Length Displa,
   orderby=2 1,
   partial=price mpg ,
   fill = C E C,
/* alabel=-25 65, */
   title=%str(Auto data: Partialling Price, MPG));

See also
biplot Biplot display of variables and observations
canplot Canonical discriminant structure plot
faces Faces display for multivariate data

