SAS Macro Programs: canplot
$Version: 1.6 (29 Nov 2006)
Michael Friendly
York University
Canonical discriminant structure plot
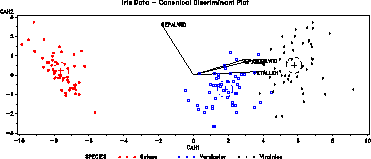
The canplot macro constructs a canonical discriminant structure
plot. The plot shows class means on the two largest canonical
variables, confidence circles for those means, and variable vectors
showing the correlations of variables with the canonical variates.
Method
Discriminant scores and coefficients are extracted from PROC CANDISC
and plotted.
Other designs may be handled either by (a) coding factor combinations
'interactively', so, e.g., the combinations of A*B are represented by
a GROUP variable, or (b) by applying the method to adjusted response
vectors (residuals) with some other predictor (class or continuous)
partialled out. The latter method is equivalent to analysis of
the residuals from an initial PROC GLM step, with the effects to be
controlled or adjusted for as predictors.
e.g., to examine Treatment, controlling for Block and Sex,
   proc glm data=..;
    model Y1-Y5 = block sex;
    output out=resids
       r=E1-E5;
  %canplot(data=resids, var=E1-E5, class=Treat, ... );
Usage
canplot is a macro program. Values must be supplied for the CLASS=
and VAR= parameters.
The interpretation of the angles betweeen variable vectors
relies on the units for the horizontal and vertical axes being made
equal (so that 1 data unit measures the same length on both axes.
The axes should be equated either by using the GOPTIONS HSIZE= VSIZE=
options, or using the macro HAXIS= and VAXIS= parameters
and AXIS statements which specify the LENGTH= value for both
axes.
The current version now uses the equate
macro if the HAXIS= and VAXIS= arguments are not supplied.
The arguments may be listed within parentheses in any order, separated
by commas. For example:
%canplot(data=inputdataset, var=predictors, class=groupvariable..., )
Parameters
The current version now provides many more parameters;
see the program header.
- DATA=_LAST_
- The name of the input dataset. If not specified, the most
recently created dataset is used.
- CLASS=
- The name of one class (group) variable
- VAR=
- List of classification (predictor)
variables
- SCALE=AUTO
- Scale factor for variable vectors in plot.
The variable vectors are multiplied by the SCALE= value, which should
be specified (perhaps by trial and error) to make the vectors and
observations fill the same plot region.
If SCALE=AUTO or
SCALE=0, the program estimates a scale factor from the ratio
of the maximum distance to the origin in the observations
relative to the variables.
- CONF=.95
- Confidence probability for canonical means
- OUT=_DSCORE_
- The name of the output data set containing discriminant scores
- ANNO=_DANNO_
- Output data set containing annotations
- PLOT=YES
- YES to produce the plot, or NO to suppress the plot
- HAXIS=
- The name of an optional AXIS statement for
the horizontal axis. The HAXIS= and VAXIS= arguments may be used
to equate the axes in the plot so that the units are the same
on the horizontal and vertical axes.
- VAXIS=
- The name of an optional AXIS statement for
the vertical axis.
- NAME=CANPLOT
- name for graphic catalog entry
- COLORS=RED GREEN BLUE BLACK PURPLE YELLOW BROWN ORANGE
- List of colors to be used for groups
- SYMBOLS=+ SQUARE STAR - PLUS : $ =
- List of symbols to be used for the various groups
(levels of the CLASS= variable).
Example
The example below plots the canonical structure of the Iris data.
The graphic options HSIZE and VSIZE are used to scale the plot so
that 1 unit on the horizontal and vertical axes are approximately
the same size.
goptions vsize=3.2 in hsize=7.5in  htext=2;
%include data(iris);

title h=2.5 'Iris Data - Canonical Discriminant Plot';
axis1 order=(-10 to 10 by 2);
axis2;
legend1 value=(h=2);
%canplot(
     data=iris, class=species,
     var=sepallen sepalwid petallen petalwid,
     haxis=axis1, vaxis=axis2, legend=legend1, hsym=1.5,
     colors=red blue black, scale=3.5);

See also
boxglm Power transformations by Box-Cox method for GLM
equate Creates AXIS statements for a GPLOT with equated axes
hemat HE plots for all pairs of response variables
heplot Plot Hypothesis and Error matrices for a bivariate MANOVA effect
meanplot Plot means for factorial designs
outlier Robust multivariate outlier detection
