| gtree |
Draw a tree dendrogram from PROC CLUSTER/VARLCUS output |
gtree |
SAS Macro Programs: gtree
$Version: 1.5 (14 Jul 1998)
Michael Friendly
York University
Draw a tree dendrogram from PROC CLUSTER/VARLCUS output
The gtree macro is applied to the OUTTREE= dataset produced
by PROC CLUSTER (to cluster observations) or PROC VARCLUS (to cluster
variables). It uses PROC GPLOT to draw the tree dendrogram of the
clustering solution.
Provisions have been made for:
- plotting trees for similarities (reversing the scale) as well
as dissimilarities,
- drawing the tree in either horizontal or vertical orientation,
- labelling items in color(s) given by variable in input data set,
- clipping the sim/dissimilarity scale to a specified low and/or high value,
- producing an output data set containing node order in the tree.
Note:
The graphic tree diagram produced by the GTREE macro can often be
obtained more simply using PROC TREE:
proc cluster data=... outtree=tree;
   id name;
   var x1-x10;
proc tree graphics data=tree;
Method
PROC TREE does not produce an output dataset suitable for drawing
a high=resolution graphic dendrogram.
Howeverm, using a method described by
Buckner and Lotz, SAS SUGI, 1988, 1363-1368,
the printed output from PROC TREE is captured to a file
(using PROC PRINTTO), then read in and parsed
to extract the parent - child information required to draw the
tree.
The gtree macro macro allows item labels up to 16 characters in length.
However, one limitation of the method used is that
the first 8 characters of the item labels MUST be unique after
removing blanks and '-', and must constitute a valid SAS name.
Usage
First, use PROC CLUSTER or PROC VARCLUS to perform the cluster analysis,
obtaining an output dataset with the OUTTREE= option. You must specify
an ID variable identifying the name of the observation or variable.
For example:
proc cluster noprint method=average outtree=tree1;
   id idname;
Then, invoke the gtree macro.
Values must be supplied ...
The arguments may be listed within parentheses in any order, separated
by commas. For example:
%gtree(tree=inputdataset, out=outputdataset, ..., )
Parameters
Default values are shown after the name of each parameter.
- TREE=_LAST_
- The name of the OUTTREE= data set from PROC CLUSTER or VARCLUS
- OUT=OUT
- The name of output data set
- HEIGHT=
- The name of a variable in the TREE= dataset
indicating height in tree
- METRIC=DIS
- Metric for the tree: Should be either SIM (SIMilarity) or DIS (DISsimilarity)
- LABEL=HEIGHT
- label for similarity/dissimilarity axis
- FONT=
- font for item labels. If no FONT= is specified, the
default SAS/GRAPH font (specified in a GOPTIONS statement) is used.
- HLABEL=
- Height for item labels. If HLABEL= is not specified, the
program calculates a height based on the number of items.
- ORIENT=V
- orientation of the tree diagram: H (horizontal) or V (vertical)
- CTREE='BLACK'
- color for tree. Should be the name of a SAS/GRAPH
color (in quotes), or the name of a variable in the TREE= dataset.
- CITEM='BLACK'
- color for item labels: quoted color or variable name
- TRIMLO=
- Specify ignore values of height less than this
- TRIMHI=
- ignore height values greater than this
- SYM=NONE
- plotting symbol for cluster joins
- PRINT=NO
- Printed output: NO means no printed output is produced;
YES means the output from PROC TREE is printed; ALL prints information about
node placement and the OUT= data set in addition.
- NAME=GTREE
- Name for the graphic output in the graphics catalog.
Example
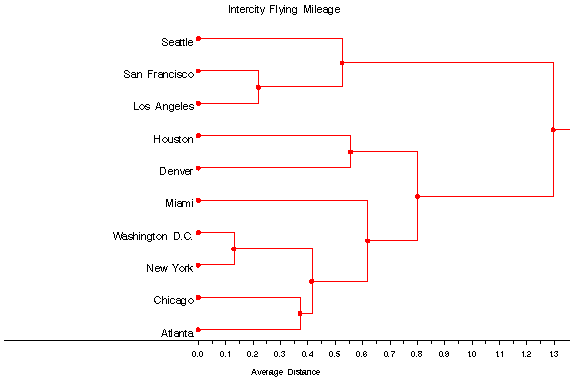
This example uses the Average Linkage method to cluster some
US cities in terms of intercity distances.
%include macros(gtree);        *-- or include in an autocall library;
data   mileages (type=distance);
input  (atlanta chicago denver houston losangel
       miami newyork sanfran seattle washdc city cityname)
       (10*5. @54 $4. @61 $15.);
CARDS;
    0                                                ATL    Atlanta
  587    0                                           CHI    Chicago
 1212  920    0                                      DEN    Denver
  701  940  879    0                                 HOU    Houston
 1936 1745  831 1374    0                            LA     Los Angeles
  604 1188 1726  968 2339    0                       MIA    Miami
  748  713 1631 1420 2451 1092    0                  NYC    New York
 2139 1858  949 1645  347 2594 2571    0             SF     San Francisco
 2182 1737 1021 1891  959 2734 2408  678    0        SEA    Seattle
  543  597 1494 1220 2300  923  205 2442 2329    0   WAS    Washington D.C.
;

proc cluster noprint method=average outtree=tree1;
   id cityname;
run;
title h=1.6 'Intercity Flying Mileage';
%gtree(tree=tree1, orient=H,label=Average Distance,sym=dot, ctree='red');
Output:

A similar tree diagram may be obtained directly with the TREE procedure:
axis1 label=none;
proc tree data=tree1
    dis horizontal
    lines=(color=red dots)
    vaxis=axis1;
See also
biplot Biplot display of variables and observations
canplot Canonical discriminant structure plot
faces Faces display for multivariate data
outlier Robust multivariate outlier detection
