SAS Macro Programs: panels
$Version: 1.7 (15 Dec 2003)
Michael Friendly
York University
This document has been superceded by that in the
Visualizing Categorical Data collection for
the panels macro.
Display a set of plots in rectangular panels
The panels macro constructs a template in which to replay a series of
panels, assumed all the same size, in a rectangular array of R
rows and C columns. The panels are displayed left-to-right across
rows, starting either from the top (order=DOWN) or bottom
(order=UP). If the number of rows and columns are unequal, the
aspect ratio of individual panels can be maintained by setting
equate=Y. It is assumed that all the plots have already been
created, and stored in a graphics catalog (the default, WORK.GSEG
is used automatically by SAS/GRAPH procedures).
Method
Usage
Create the graphs using any SAS program steps, macro calls, etc.
As they are created they are automatically stored in a SAS/GRAPH
graphics catalog.
Then, invoke the panels macro:
   %panels(
      rows= number of rows of plots,
      cols= number of columns of plots,
      plots= total number of plots to be displayed,
      top= percent of display for top panel,
      order= order for rows of the display (UP or DOWN),
      replay= List of plots to replay,
      equate= Adjust sizes to maintain aspect ratio? (Y or N),
      first= number of first catalog entry to use
      last= number of last catalog entry to use
      template= name of template created,
      tc= name of template catalog,
      gin= name of graphics catalog containing plots,
      gout= name of output graphics catalog containing resulting panels
  		 );
The ROWS= and COLS= arguments are required, and specify the
size of the array of plots to be displayed. These are the only
required arguments.
The arguments may be listed within parentheses in any order, separated
by commas. For example:
%panels(rows=2, cols=2, equate=Y)
If there are fewer than &ROWS*&COLS plots, specify the number of plots
as the PLOTS= argument. Optionally, there can be an additional
plot, which is displayed (as a GSLIDE title, for example) in
the top nn% of the display, as specified by the TOP= argument.
Parameters
- ROWS=
- number of rows of plots,
- COLS=
- number of columns of plots,
- PLOTS=
- Total number of plots to be displayed.
If there are fewer than &ROWS*&COLS plots, specify the number
as the PLOTS= argument. Optionally, there can be an additional
plot, which is displayed (as a GSLIDE title, for example) in
the top nn% of the display, as specified by the TOP= argument.
- TOP=
- Percent of display for top panel.
- ORDER=
- Order for rows of the display (UP or DOWN).
The ORDER= argument specifies the order of the panels in the
display. ORDER=UP means that the panels in the bottom row are
numbered 1, 2, ..., &COLs. ORDER=DOWN means that the panels in
the top row are numbered 1, 2, ..., &COLs.
- REPLAY=
- List of plots to replay.
The REPLAY= argument specifies the list of plots to be replayed
in the constructed template, in one of the forms used with the
PROC GREPLAY REPLAY statement, for example, REPLAY=1:1 2:3 3:2
4:4 or REPLAY=1:plot1 2:plot3 3:plot2 4:plot4
- EQUATE=
- Adjust sizes to maintain aspect ratio? (Y or N).
Use EQUATE=Y when the number of rows and columns differ to
keep the panels from being deformed.
- FIRST=1
- Number of first catalog entry to use
By default, the REPLAY= argument is constructed to replay plot
i in panel i. If the REPLAY= argument is not specified, you can
override this default assignment by specifying FIRST= the sequential
number of the first graph in the graphics catalog to plot (default:
first=1), where:
- >0 means absolute number of first graph,
- <1 means number of first graph relative to last (i.e. 0 means
last graph only, -1 means first is one before last, etc.)
- LAST=0
- Number of the last catalog entry to use (default:0), where:
- >0 means absolute number of last graph,
- <1 means number of last graph relative to number
of graphs in the catalog (i.e. 0 means last graph
in the catalog, -1 means one before last, etc.)
- TEMPLATE=
- Name of template created,
- tc=
- Name of template catalog,
- gin=
- Name of graphics catalog containing plots (default: WORG.GSEG)
- gout=
- Name of output graphics catalog containing resulting panels
Example
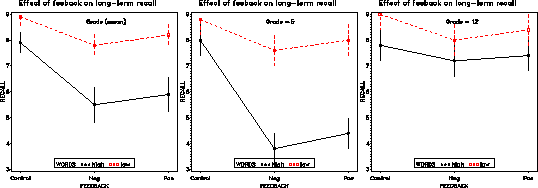
In the example of the meanplot macro, 3 plots are produced for mean recall
by grade.
%meanplot(data=raw,
	freq=freq,
	response=recall, class=Feedback Words Grade, cmean=NO, ploc=45 95);
The three panels are combined using the panels macro, giving the plot
below.
%panels(rows=1, cols=3, equate=Y);

See also
coplot
meanplot Plot means for factorial designs
scatmat Scatterplot matrix
