| mosmat | Macro interface for mosaic matrices | mosmat |
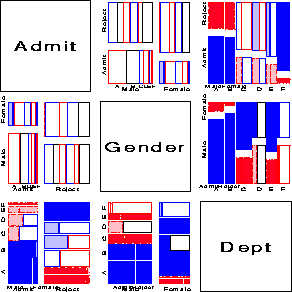
Each pairwise plot shows the marginal frequencies to the order specified by
the PLOTS= parameter. When PLOTS=2, these are the bivariate margins, and the residuals from marginal
independence are shown by shading. When PLOTS >2, the observed frequencies in a higher-order marginal table are displayed,
and the model fit to that marginal table is determined by the FITTYPE= parameter.
DATA=_LAST_]
V1-V3) are not allowed. The levels of the factor variables may be character or
numeric, but are used as is in the input data. Upper/lower case in the
variable names is respected in the diagonal label panels. You may omit the VAR= variables if variable names are used in the VORDER= parameter.
PLOTS=2]
CONFIG=1 2 / 1 3 / 2 3, or (using variable names) CONFIG = A B / A C / B C. Note that the numbers refer to the variables after they have been
reordered, either sorting the data set, or by the
VORDER= parameter.
SORT=YES sorts the data in the reverse order that they are listed in the VAR= paraemter, so that the variables are entered in the order given in the VAR= parameter. Otherwise,
SORT= lists the variable names, possibly with the DESENDING or NOTSORTED options
in the reverse of the desired order. e.g., SORT=C DESCENDING B DESCENDING A.
%include vcd(mosmat);        *-- or include in an autocall library;
%include catdata(berkeley);
proc format;
   value admit 1="Admit" 0="Reject" ;
   value dept  1="A" 2="B" 3="C" 4="D" 5="E" 6="F";
   value $sex  'M'='Male'   'F'='Female';
%table(data=berkeley, var=Admit Gender Dept, weight=freq, char=Y,
        format=admit admit. gender $sex. dept dept.,
		  order=data, out=berkeley);

%mosmat(data=berkeley, vorder=Admit Gender Dept, sort=no, htext=3.5);
%mosmat(data=berkeley, vorder=Admit Gender Dept, sort=no, htext=3.5,
	plots=3, fittype=CONDIT);

