| powerlog | Power for logistic regression, quantitative predictor | powerlog |
%powerlog(p1=.08, p2=%str(.16, .24));
x TO y BY z, or a combination of these.
However, you must surround the P2= value with %STR() if any commas appear
in it. For example,
        p2=.10 to .30 by .05
        p2=%str(.10, .13, .20)
RSQ=0 for a 1-predictor model.
PLOT=N * POWER=RSQ. No plots are produced if PLOT= is blank.
THETA, the odds-ratio determined by the
values of P1 and P2.
If age is another predictor, how does sample size vary with the RSQ between cholesterol and age? Assume the RSQ varies between 0.2 and 0.4.
%include vcd(powerlog);        *-- or include in an autocall library;
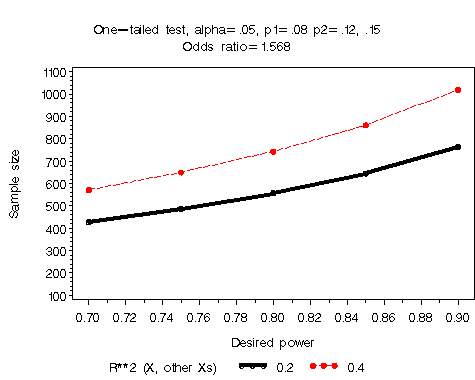
%powerlog(p1=.08, p2=%str(.12, .15), rsq=%str(.2, .4) );
This produces the printed output below:
   One-tailed test, alpha=.05, p1=.08 p2=.12, .15

   --------------------------------------------
   |                  |Pr(event) at X_mean+std|
   |                  |-----------------------|
   |                  |   0.12    |   0.15    |
   |                  |-----------+-----------|
   |                  | R**2 (X,  | R**2 (X,  |
   |                  | other Xs) | other Xs) |
   |                  |-----------+-----------|
   |                  | 0.2 | 0.4 | 0.2 | 0.4 |
   |------------------+-----+-----+-----+-----|
   |Power             |     |     |     |     |
   |------------------|     |     |     |     |
   |0.7               |  429|  572|  183|  245|
   |------------------+-----+-----+-----+-----|
   |0.75              |  488|  650|  207|  276|
   |------------------+-----+-----+-----+-----|
   |0.8               |  558|  744|  235|  314|
   |------------------+-----+-----+-----+-----|
   |0.85              |  646|  861|  270|  361|
   |------------------+-----+-----+-----+-----|
   |0.9               |  765| 1020|  318|  424|
   --------------------------------------------
Two graphs are produced, one for P2=.12, and the other for P2=.15.


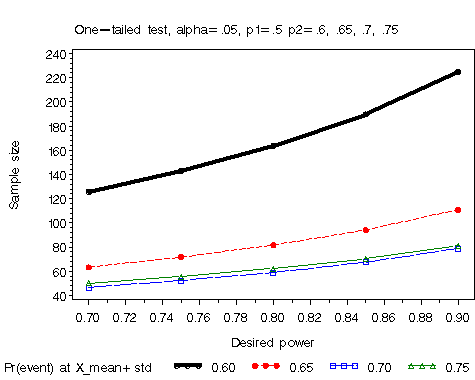
%powerlog(p1=.5, p2=%str(.6, .65, .7, .75), rsq=0, plot = N * power = p2);This produces the printed output below:
   One-tailed test, alpha=.05, p1=.5 p2=.6, .65, .7, .75

   --------------------------------------------
   |                  |Pr(event) at X_mean+std|
   |                  |-----------------------|
   |                  | 0.6 |0.65 | 0.7 |0.75 |
   |------------------+-----+-----+-----+-----|
   |Power             |     |     |     |     |
   |------------------|     |     |     |     |
   |0.7               |  126|   63|   46|   50|
   |------------------+-----+-----+-----+-----|
   |0.75              |  143|   72|   52|   56|
   |------------------+-----+-----+-----+-----|
   |0.8               |  164|   82|   59|   62|
   |------------------+-----+-----+-----+-----|
   |0.85              |  190|   94|   67|   70|
   |------------------+-----+-----+-----+-----|
   |0.9               |  225|  111|   79|   81|
   --------------------------------------------
The graphical output shows how sample size depends on the value of P2 for various levels of power.
