Data Visualization in R
Michael Friendly, SCS Short Course
September/October, 2018
Getting started
To profit best from this course, you need to install both R and R Studio on your computer. See the install tutorial for further details.
The basic R system: R console (GUI) & packages
- Download from: http://cran.us.r-project.org/
- Run (double-click) the installation file.
- Add my recommended packages: run
source("http://datavis.ca/courses/RGraphics/R/install-pkgs.R")
The R Studio IDE:
- Download from: https://www.rstudio.com/products/rstudio/download/
Session 1: Overview
Topics:
- Getting started: R, R Studio
- The roles of graphics in data analysis (exploration, analysis, presentation)
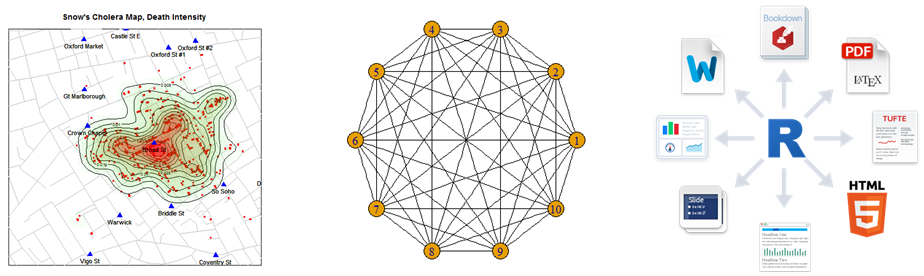
- What can I do with R graphics: Anything!
- R graphics systems: base graphics; grid graphics; ggplot2
- Reproducible analysis and reporting with knitr and R markdown with R Studio
R scripts:
- Scatterplot matrix example: prestige-pairs.R; Output: prestige-pairs.html
- Graphical analysis of Duncan data: duncan-plots.R; Output: duncan-plots.html
Session 2: Standard graphics in R
Topics:
- R has a simple, object-oriented design that facilitates data analysis and plots.
- Much of what you need or want to do can be done with this, by simply using
plot(object). - Tweaking graphs: Learn to control the details of R graphs by controling the graphic parameters: color, point symbols, line styles and so forth.
- Annotating graphs: Graphs for different purposes can be enhanced by adding features, such as fitted lines, confidence envelopes, data ellipses, or text
R scripts:
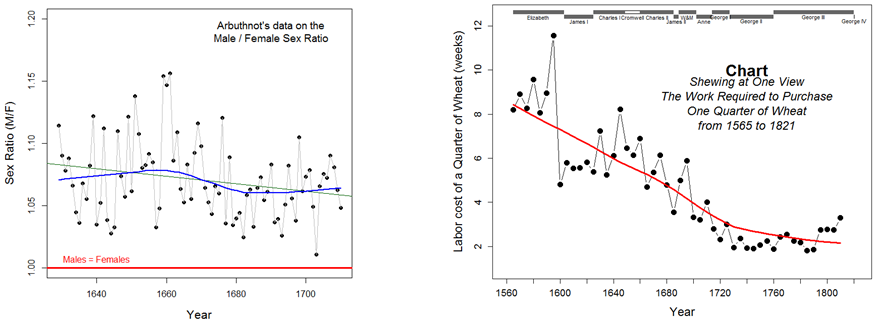
- Plotting Arbuthnot’s sex ratio data: arbuthnot.R; Output: arbuthnot.html
- Playfair’s chart of wheat and wages: playfair-wheat.R; Output: playfair-wheat.html
- Galton’s peas: galton-peas.R; Output: galton-peas.html
Session 3: Grid and lattice graphics
This session is not being taught this year. The lecture notes and examples are available online.
 - Lecture notes: 1up PDF; 4up PDF
Topics:
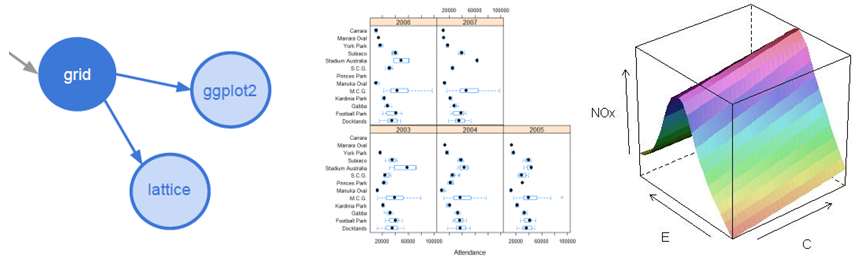
- The grid graphics system for R provides an alternative and more powerful means to construct data graphics in R.
- The
latticepackage provides functions for drawing all standard plots (scatterplots, histograms, density plots, etc.), usually with more pleasing default results, but more importantly, allows you to compose collections (“small multiples”) of simpler graphs from structured subsets of the data. - The
vcdpackage uses grid graphics to produce a wide variety of plots for categorical data (mosaic plots, spine plots, sieve diagrams, etc.)
R scripts:
- mtcars data lattice-mtcars.R
Session 4: ggplot2
Topics:
ggplot2takes a totally different, but arguably most powerful, approach to the construction of statistical graphs, based on the “Grammar of Graphics”.- The graphic language of ggplot2 makes it easier to think of a graph as composed of layers (points, lines, regions), each of which is rendered with various graphical attributes.
ggplot2is part of a workflow for “tidy” data manipulation and graphics that is well worth learning.
R scripts:
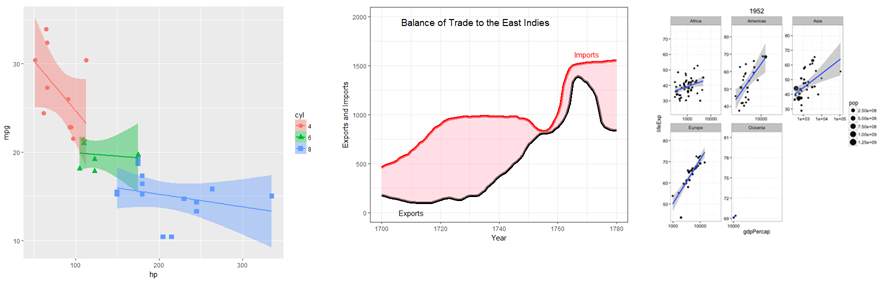
- Plots of cars data with ggplot2: gg-cars.R. Output: gg-cars.html
- Playfair Balance of Trade data: playfair-east-indies.R. Output: playfair-east-indies.html
- Plot Arbuthnot’s data with ggplot2 arbuthnot-gg.R. Output: arbuthnot-gg.html
- 2d Density Plot of Geyser Data: geyser.R. Output: geyser.html