SAS Macro Programs: cpplot
$Version: 1.5 (26 May 2003)
Michael Friendly
York University
Plots of Mallow's C(p) and related statistics for model selection
The CPPLOT macro plots of Mallow's C(p) and related statistics for
model selection in linear models. In a graph of C(p) vs. p,
good models are those for which C(p) <= p. The program
optionally plots other equivalent statistics for which the
reference line for good models is horizontal.
- (C(p) / p) vs. p. The reference value for good models is
at (C(p)) / p = 1. This is referred to as the CD plot
in the GPLOT= and PPLOT= parameters
- F(p) vs. p, where F(p) is the partial F statistic for
testing significance of the variables omitted from the
model. The reference value for good models is at F(p)
= 1. This is referred to as the F plot
in the GPLOT= and PPLOT= parameters
- Prob ( F > F(p) ) vs. p, plotted on a log scale. This
turns the plot scale around, so that good models are
highest on the vertical scale. This is referred to as the FPROB plot
in the GPLOT= and PPLOT= parameters
- AIC vs. p, where AIC is Akaike's Information Criterion.
Good models are those
lowest on the vertical scale. This is referred to as the AIC plot
in the GPLOT= and PPLOT= parameters
The program produces a high-resolution plot of C(p) by default.
Optionally, it can produce printer plots in any of the above forms.
These are useful only with SAS Version 6.07 or later, where PROC PLOT
can label points with character strings.
Method
The macro uses PROC REG with / SELECTION=RSQUARE on the MODEL
statement, and extracts the values to be plotted using the
OUTEST= option.
cpplot uses the label
macro to label points
in these plots.
Usage
cpplot is a macro program. Values must be supplied for the
YVAR= and XVAR= parameters
The arguments may be listed within parentheses in any order, separated
by commas. For example:
%cpplot(YVAR=dependentvar, XVAR=predictorvars, ..., )
Parameters
- YVAR=
- The name of the dependent variable
- XVAR=
- A list of potential independent variables in the model
- DATA=_LAST_
- The name of input data set
- PLOTCHAR=1 2 3 4 5 6 7 6 8 9 0
- Symbols used to identify the independent
variables included in any model in the plot.
Usually one would specify the first character
of the name of each independent variable, in
the order listed in XVAR. The PLOTCHAR list is
parsed as blank-delimited words, so each symbol
may consist of more than one character.
However, blanks are removed from the symbol
used to identify a particular model.
- OPTIONS=
- Other options for the MODEL statement, e.g.,
OPTIONS=AIC to print AIC values.
- GPLOT=CP
- High-resolution (PROC GPLOT) plots: Specify a
list of any
one or more of CP CD F PROBF (separated by blanks).
- PPLOT=NONE
- Printer plots: any one or more of CP CD F
PROBF
- CPMAX=30
- Maximum value of C(p) plotted. Since
values of C(p) can be extremely high for
unreasonable models, use this parameter to
restrict the plot to the more interesting range
of models for which C(p) &le CPMAX. Any models
with greater values of C(p) are shown off-scale,
labelled in red.
- FMAX=30
- Maximum value of F plotted
- NAME=CPPLOT
- Name for the graphic catalog entry
- GOUT=
- Name of the graphics catalog in which the plot is to
be stored. Default: WORK.GSEG.
Example
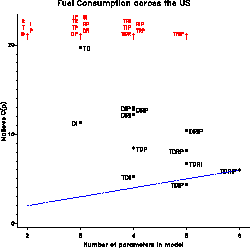
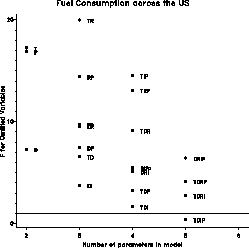
The example produces C(p) and F plots of models
predicting FUEL consumption from all subsets of the
predictor variables TAX, DRIVERS, ROAD, INCome, and POPulation.
%include data(fuel) ;
%include macros(cpplot);       * or, store in autocall library;
%cpplot(data=fuel,
      yvar=fuel,
      xvar=tax drivers road inc pop,
      gplot=CP F, plotchar=T D R I P,
      cpmax=20, fmax=20 );


See also
boxcox Power transformations by Box-Cox method
label Create Annotate dataset to label observations
inflplot Influence plot for regression models
partial Partial regression residual plots

