| hemat |
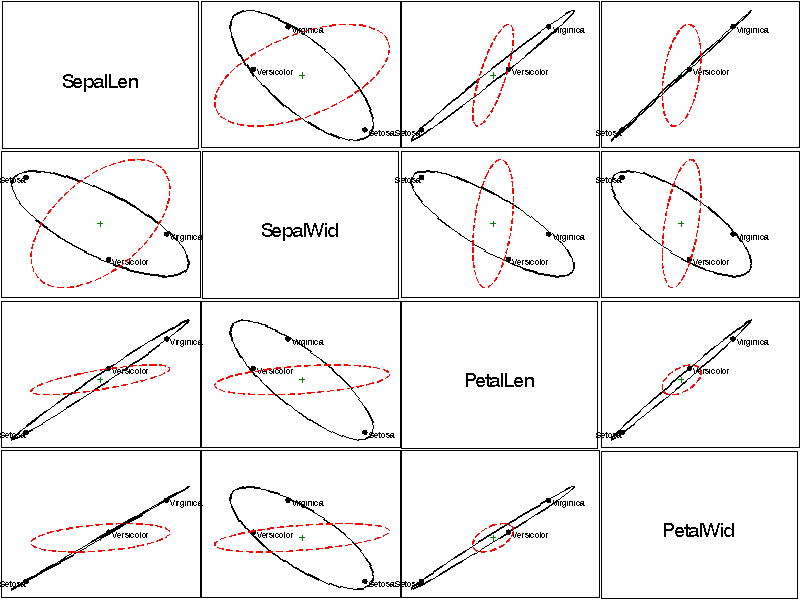
HE plots for all pairs of response variables |
hemat |
SAS Macro Programs: hemat
$Version:
Michael Friendly
York University
HE plots for all pairs of response variables
The HEMAT macro plots the covariance ellipses for a hypothesized (H)
effect and for error (E) for all pairs of variables from a MANOVA
or multivariate multiple regression.
Method
Usage
hemat is a macro program. Values must be supplied
The arguments may be listed within parentheses in any order, separated
by commas. For example:
  %hemat(data=iris, stat=stats,
         var=SepalLen SepalWid PetalLen PetalWid,
         effect=species);
Parameters
Default values are shown after the name of each parameter.
- DATA=
-
Name of the raw data set to be plotted [Default:
DATA=_LAST_]
- STAT=
-
Name of
OUTSTAT= dataset from PROC GLM
- EFFECT=
-
Name of MODEL effect to be displayed for the H matrix.
This must be one of
the terms on the right hand side of the MODEL statement used
in the PROC GLM or PROC REG step, in the same format that this
efffect is labeled in the
STAT= dataset. This must be one of
the values of the _SOURCE_ variable contained in the STAT=
dataset.
- VAR=
-
Names of response variables to be plotted - can be
a list or X1-X4 or VARA--VARB [Default:
VAR=_NUMERIC_]
- NAMES=
-
Alternative variable names (used to label the diagonal
cells.)
- M1=
-
First matrix: either H or H+E [Default: M1=H]
- M2=
-
Second matrix either E or I [Default: M2=E]
- SCALE=
-
Scale factors for M1 and M2. See description in HEPLOT
- HTITLE=
-
Height of variable name in diagonal cells
- SYMBOLS=
-
Not used
- COLORS=
-
Colors for the H and E ellipses [Default:
COLORS=BLACK RED]
- ANNO=
-
Annotate diag or off-diag plot [Default:
ANNO=NONE]
- GTEMP=
-
Temporary graphics catalog [Default:
GTEMP=GTEMP]
- KILL=
-
Delete grtemp when done [Default:
KILL=Y]
- GOUT=
-
Name of the graphic catalog [Default:
GOUT=GSEG]
Example
Determine how the variables in the Iris data set vary with
species:
%include macros(hemat);        *-- or include in an autocall library;
%include data(iris);

proc glm data=iris outstat=stats;
  class species;
  model SepalLen SepalWid PetalLen PetalWid = species / nouni ss3;
  manova h=species;
  run;

%hemat(data=iris, stat=stats,
	var=SepalLen SepalWid PetalLen PetalWid,
	effect=species
	);
Output:

See also
biplot Generalized biplot of observations and variables
canplot Canonical discriminant structure plot
ellipses Plot bivariate data ellipses
hemreg Extract H and E matrices for multivariate regression
heplot Plot Hypothesis and Error matrices for a bivariate MANOVA effect
meanplot Plot means for factorial designs
panels Display a set of plots in rectangular panels
