DataVis.ca
Michael Friendly
York University

Darts |
|---|
 Evil Pies
Here is a rogues gallery of a few of the most evil pies I've seen recently.
| Picture | Words |
|---|---|

|
A Not So Real Pie Full size, uncropped
This mouth watering item is from A Real Pie Chart: America's Favorite Pies, on Life's Little Mysteries. It purports to show the results of a survey, asking "What are your three favorite types of pies"? A graphic designer was presumably paid to make this visually appealing, even exploding the Apple slice for graphic effect. This pie is evil because each person voted for up to three types of pies, and it is impossible to tell from either the pie slices or the percents what is what. Merely saying that the "total adds up to more than 100 percent" doesn't help. It's like fudging your tax return and including a note saying "I lied, but the result looks pretty." Oh, and why is Apple crumb a separate category? |
|
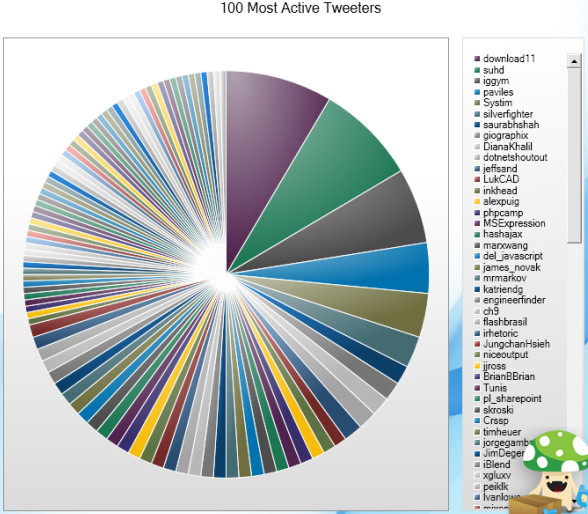
Top 100 always a bad idea Full size
This example, taken from Chandoo, comes originally from a ReWriteWeb article, "10 ways to archive your tweets". As Chandoo notes, The real crime is committed by Archivist a desktop application designed by a Microsoft team for archiving and analyzing your tweets. Showing the top 100 of anything is always a bad idea, but particularly bad when shown in a pie chart like this, having to recycle colors endlessly to smaller and smaller wedges. But perhaps the wonks at Microsoft were just thinking to make a pretty picture. Perhaps both the designers and users need to get a life, or perhaps a Second Life where tweets can be traded for useful things like ruby slippers or a new hair piece. Social media has created many opportunities for incisive graphic displays. Put this one at the bottom of the list. |
|
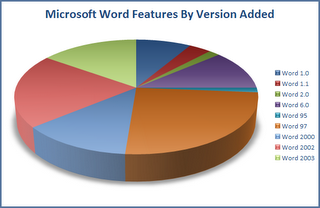
Only God Can Bless Microsoft 3D Pie Charts
Full size
You've gotta hand it to those crafty folk at Microsoft, who gave us the tools of modern enterprise. Now nearly everyone can turn an excel spreadsheet into nifty 3D pie charts, whether they mean anything or not. The 3D effects, with shading make a pretty picture, even though they distort what is intended to be shown. One supposes that the purpose of this graph was to show the number of "features" introduced into various versions of Microsoft Word. A simple line graph would have done a better job, The caption on such a graph could read, "It took us a while to get to Word 97, and since then we've been making incremental improvements." |
|
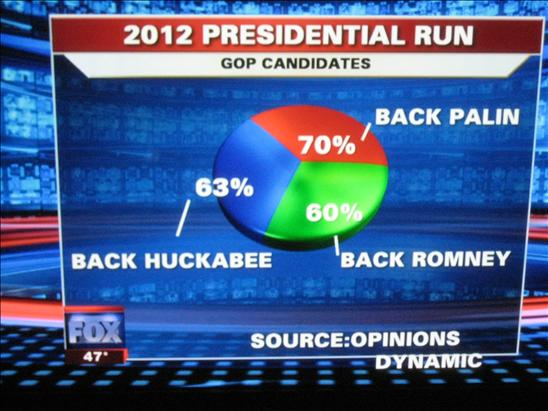
Fox News: The Best Pie Chart? Ever?
Full size (548 x 411; 383K)
Flowing Data reported on this one in November 2009. Of course, Fox News was reporting the percent of people who said they would back each candidate, and people were allowed more than one choice. But someone thought those numbers would look better in a pie chart. |

|
Maybe the only REAL pie chart
Full size (523 x 349; 301K)
This has to be my all time favorite pie chart: clear data, accurately reported. Skill testing question: What percent of the pie was eaten? |
