DataVis.ca
Michael Friendly
York University

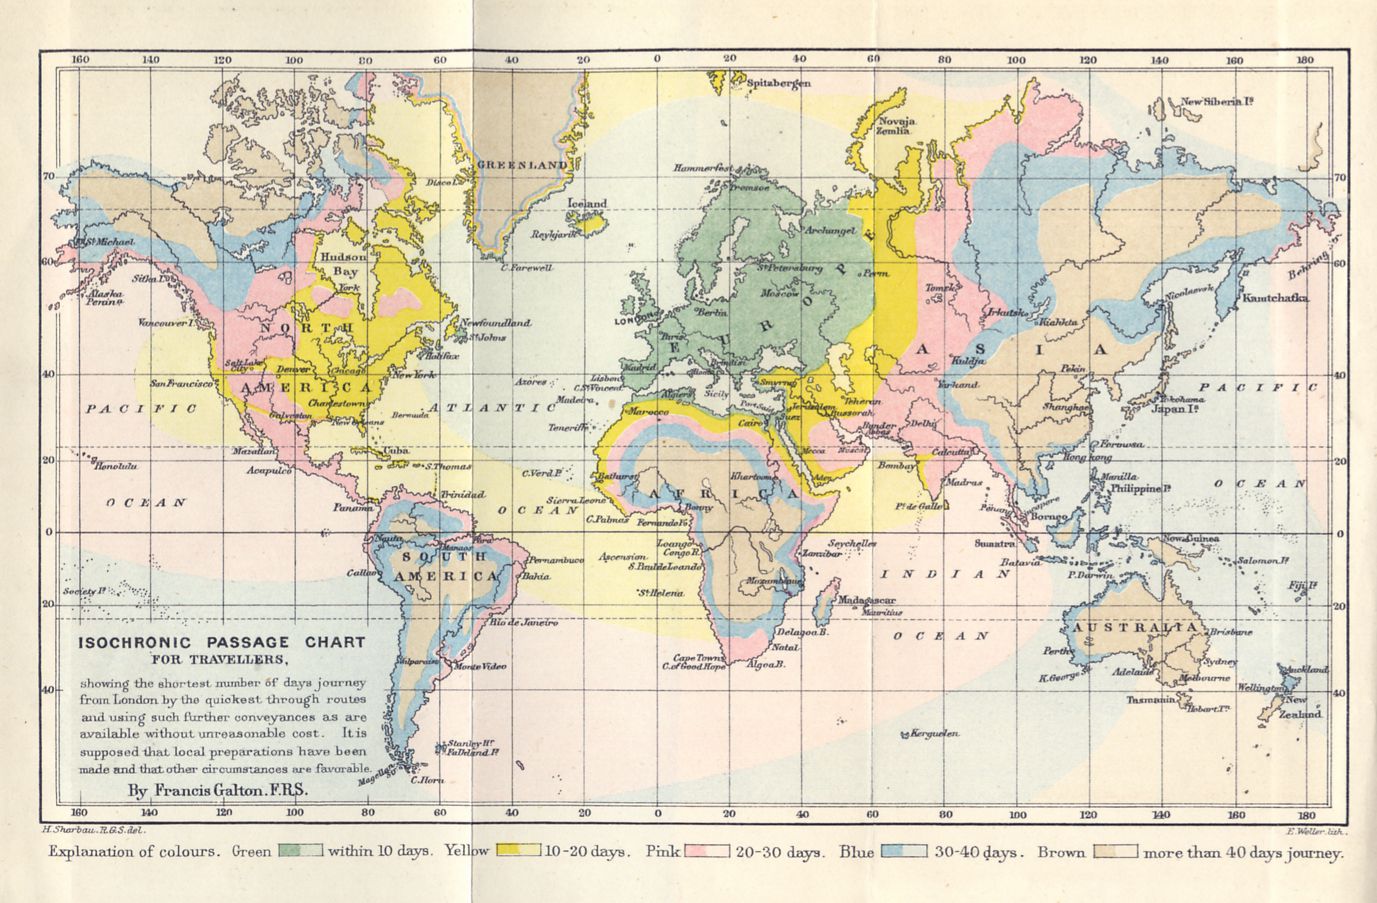
Title: Isochronic Passage Chart for Travellers
Author: Francis Galton
Location: London, England
Year: 1881
Francis Galton is well-known as a discoverer of correlation, regression and the bivariate normal distribution on which these are based. Long before he turned his attention to questions of heritability (height of children vs. height of parents), Galton studied other complex relations using charts or diagrams of isolevel contours to show a third dimension on a 2D plane.
This lovely Isochronic Passage Chart (1881) tries to show how long it would take to travel anywhere in the world from London, using iso-contours depicted by shading. For his data, Galton used many sources, but most ingenious was an experiment in which he sent dated letters to various correspondents and asked that they reply indicating when the letters arrived.
Image Source: Royal Geographical Society, London, Image number: S0011891.
Original caption: 'Isochronic Passage Chart for Travellers showing the shortest number of days journey from London by the quickest through routes and using such further conveyances as are available without unreasonable cost. It is supposed that local preparations have been made and that other circumstances are favorable.' Published for the Proceedings of the Royal Geographical Society, 1881.
 Except where otherwise noted, the Gallery of Data Visualization by
Michael Friendly is licensed under a
Except where otherwise noted, the Gallery of Data Visualization by
Michael Friendly is licensed under a Creative Commons Attribution-NonCommercial 3.0 License. Please cite any uses of this work as shown below.
Citation: Friendly, Michael (2001), Gallery of Data Visualization, Electronic document, http://www.datavis.ca/gallery/,