DataVis.ca
Michael Friendly
York University

Title: The Last to Hit .400?
Author: New York Times
Location: New York City, NY, U.S.A.
Year: 2011
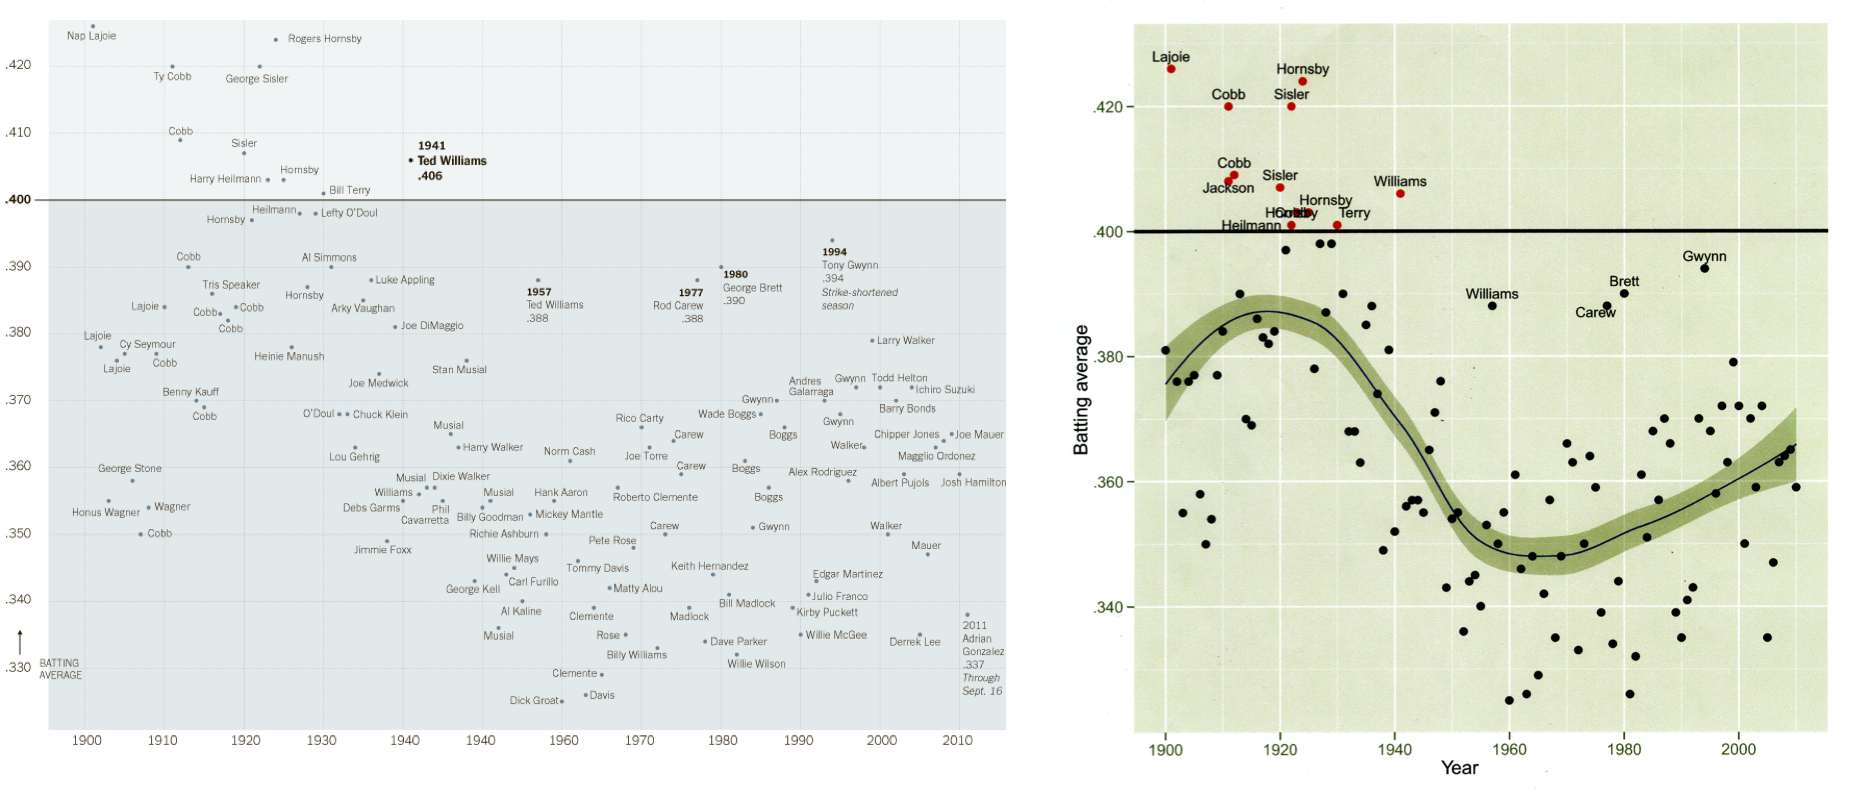
The graph at the left appeared in the Sunday New York Times Sports section, September 17, 2011, in an article recounting that Ted Williams in 1941 was the last player to achieve a batting average over .400. The goal is to show the vast empty space above .400 after 1941.
The graph at the right shows the same data (for the top batters in each season + all .400 hitters), plus a smoothed curve tracking the trend over time in top batting average. This shows something quite surprising, namely that the top batting averages have been on an up-swing since the nadir in the early 1960s.
More on the story: https://www.nytimes.com/2011/09/18/sports/baseball/ted-williamss-406-average-is-more-than-a-number.html
©2007.
 Except where otherwise noted, the Gallery of Data Visualization by
Michael Friendly is licensed under a
Except where otherwise noted, the Gallery of Data Visualization by
Michael Friendly is licensed under a
Creative Commons Attribution-NonCommercial 3.0 License. Please cite any uses of this work as shown below.
Citation: Friendly, Michael (2001), Gallery of Data Visualization, Electronic document, http://www.datavis.ca/gallery/,
Except where otherwise noted, the Gallery of Data Visualization by
Michael Friendly is licensed under a Creative Commons Attribution-NonCommercial 3.0 License. Please cite any uses of this work as shown below.
Citation: Friendly, Michael (2001), Gallery of Data Visualization, Electronic document, http://www.datavis.ca/gallery/,