Milestones in the History of
Thematic Cartography,
Statistical Graphics,
and Data Visualization
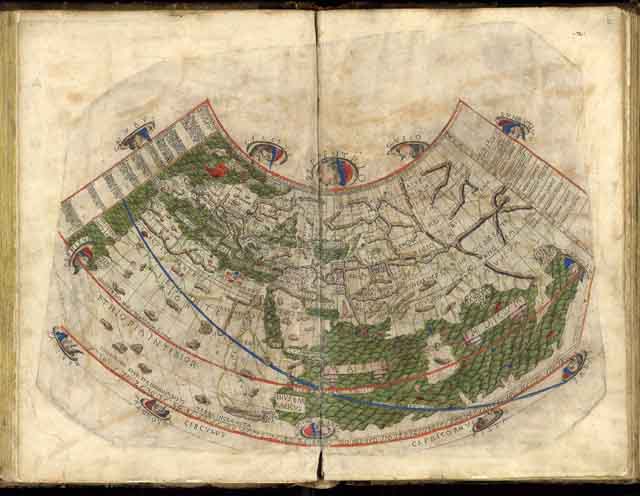
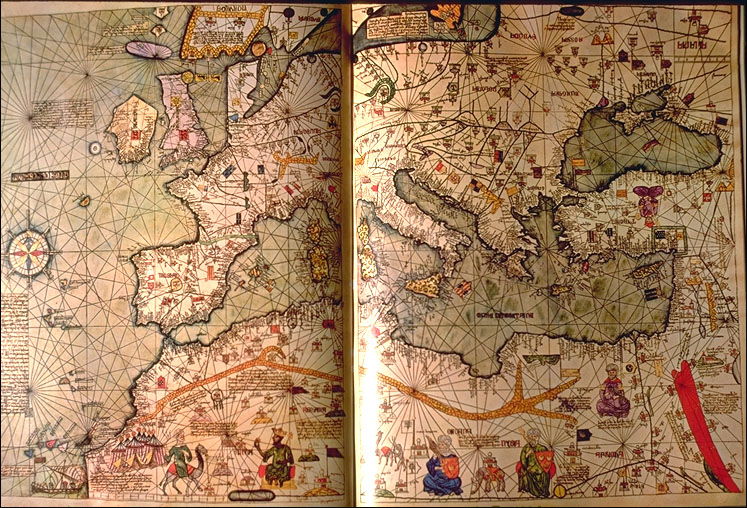
Ptolemy map Mercator portrait Catalan Atlas
Pre-1600 Ptolemy 1842 map Mercator portrait Catalan Atlas
Images: Pre-1600
Pre-1600

2.  Pre-1600: Early maps and diagrams

History of Cartography Project
Map History Gateway
The earliest seeds of visualization arose in geometric diagrams, in tables of the positions of stars and other celestial bodies, and in the making of maps to aid in navigation and exploration. We list only a few of these here to provide some early context against which later developments can be viewed.

In the 16th century, techniques and instruments for precise observation and measurement of physical quantities were well-developed. As well, we see initial ideas for capturing images directly, and recording mathematical functions in tables. These early steps comprise the beginnings of the husbandry of visualization.

c. 6200 BC
The oldest known map? (There are several claimants for this honor.)- Museum at Konya, Turkey. Added:: 05/10/01:MF
IMG: Konya town map (280 x 160; 7K)
FIG: Konya town map (555 x 317; 24K)
TXT: Town map, with an errupting volcano (Hasan Daö?) and the Konya plain
TXT: An extended description of the most ancient maps
c. 550 BC
The first world map? (No extant copies, but described in books II and IV of Herodotus' ``Histories'' [254]- Anaximander of Miletus (c.610BC-546BC), Turkey. Added:: 07/02/01
FIG: The first world map (325 x 326; 3K)
TXT: Anaximander biography
366-335 BC
The first route map (``carte routière''), showing the whole of the Roman world, a map from Vienna, through Italy, to Carthage; painted on parchment, 34 cm. high, by 7 m. in length. (Named the table of Peutinger, after a 16th century German collector.)- Italy. Added:: 06/21/05:YL
FIG: Peutinger map (1251 x 833; 330k)
TXT: Peutinger map background
TXT: Peutinger map images
The whole of the Roman world is reproduced on this painted parchment 34 centimetres in height and almost 7 metres in length. Although it is the most reproduced Roman chart, the Table of Peutinger does not make it possible to perceive the extent of the cartographic work undertaken by the Romans. Land conquerors, they had a utilitary vision of geography and their cartographic representations were related to the imperial conquests. Topographers accompanied the Roman armies in their campaigns in order to recognize the conquered grounds. Information collected was used for the military needs and the development of infrastructures such as the routes, but also to describe the routes. The table of Peutinger, named after the XVI century German collector to which it was offered, was a form of very widespread geographical description. If this chart does not bring topographic information, it gives indications of distances and size of the places, very practical information for the traveller. The North-South distances are represented on a smaller scale than the East-West distances, thus making it possible to the traveller to unfold or unroll the section which corresponded to its course.
240 BC
Calculation of the diameter of the earth by measuring noontime shadows at sites 800 km. apart- Eratosthenes (of Cyrene) (276BC-194BC), Libya. Added:: 06/24/05:YL
TXT: Eratosthenes biography
TXT: Eratosthenes of Cyrene
Assuming the earth is a sphere, the measured angle between the sites is seven degrees and the circumference is about 50 times 800 km., or about 40,000 km.
170 BC
Invention of parchment. Parchment was superior to papyrus because it could be printed on both sides and folded.- Pergamon. Added:: 06/25/05:YL
TXT: History of parchment
134 BC
Measurement of the year with great accuracy and building of the first comprehensive star chart with 850 stars and a luminosity, or brightness, scale; discovery of the precision of the equinoxes- Hipparchus (of Rhodes) (190-120BC), Turkey. Added:: 06/24/05:YL
TXT: Astronomy
TXT: Hipparchus the Astronomer
TXT: Hipparchus biography
He seems to have been very impressed that either of two geometrically constructed hypotheses could 'save the appearance' of the path that a planet follows
c. 105
Invention of paper, replacing (somewhat later) writing and other inscriptions on wood, cloth, stone, etc.-Tsai Lun , China Added:: 04/22/05
PIC: Tsai Lun portrait (180 x 180; 14K)
TXT: Tsai Lun, portrait and biography
TXT: Timeline of paper making
c. 150
Map projections of a spherical earth and use of latitude and longitude to characterize position (first display of longitude)- Claudius Ptolemy (c. 85-c. 165), Alexandria, Egypt. Added:: 11/22/00
PIC: Ptolemy, portrait from ca. 1400 (90 x 109; 9K)
FIG: Ptolemy's world map, republished in 1482 (640 x 496; 40K)
TXT: Ptolemy world map description, with images
TXT: The world according to Ptolemy
TXT: Ptolemy's world map, description and high-res image
TXT: Ptolemy history
c. 950
Earliest known attempt to show changing values graphically (positions of the sun, moon, and planets throughout the year)- Europe [91].
IMG: see [291,p. 28] Added:: 12/05/00
IMG: Planetary movements icon (222 x 124; 19K)
FIG: Planetary movements diagram (750 x 420; 92K)
c. 1280
Triangular diagrams of paired comparisons for electoral systems (how to elect a Pope or Mother Superior, when all the candidates are voting)- Ramon Llull (1235-1316), Spain [176]. Added:: 06/12/03
PIC: Llull portrait (409 x 477; 69K)
TXT: Llull portraits
TXT: Llull's writings on electoral systems
1305
Mechanical diagrams of knowledge, as aids to reasoning (served as an inspiration to Leibnitz in the development of symbolic logic)- Ramon Llull (1235-1316), Spain. Added:: 06/12/03
FIG: Llull's tree of knowledge (329 x 467; 79K)
FIG: Llull's mechanical disks (518 x 354; 37K)
c. 1350
Proto-bar graph (of a theoretical function), and development of the logical relation between tabulating values, and graphing them (pre-dating Descartes). Oresme proposed the use of a graph for plotting a variable magnitude whose value depends on another, and, implicitly, the idea of a coordinate system- Nicole Oresme (Bishop of Lisieus) (1323-1382), France [217,218]
PIC: Oresme portrait (709 x 688; 105K)
IMG: Oresme bar graph (225 x 117; 6K)
IMG: Page from Oresme (453 x 600; 19K)
1375
Catalan Atlas, an exquisitely beautiful visual cosmography, perpetual calendar, and thematic representation of the known world- Abraham Cresques (1325-1387), Majorca, Spain. Added:: 05/18/01
IMG: Carte de l'Europe, de l'Afrique du Nord et du Proche-Orient, BNF, ESP 30 (266 x 168; 48K)
IMG: Carte de l'Europe, de l'Afrique du Nord et du Proche-Orient, BNF, ESP 30 (747 x 508; 195K)
FIG: Catalan Atlas, detail: Europe, North Africa (747 x 508; 195K)
TXT: BNF description of Atlas catalan (BNF, ESP 30)
TXT: BNF listing of images from the Catalan Atlas
TXT: Detailed description of Catalan Atlas and Abraham Cresques (Henry-Davis)
c. 1450
Graphs of distance vs. speed, presumably of the theoretical relation - Nicolas of Cusa (1401-1464), Italy. Added:: 07/25/03
TXT: Cusa biography
TXT: English translations of the works of Cusa
TXT: Annotated links: Nicolas of Cusa on the Web
1453
Invention of moveable type printing press, and printing of the Mazarin bible (leads to a decline in the use of mixed text and graphics)- Johann Gutenberg (1387-1468), Germany. Added:: 12/10/00
PIC: Gutenberg portrait (124 x 114; 8K)
IMG: Gutenberg type sample (116 x 145; 5K)
FIG: Page from the Mazarin bible (375 x 952;196K)
c. 1500
Use of rectangular coordinates to analyze velocity of falling objects- Leonardo da Vinci (1452-1519), Florence, Italy [309].
PIC: da Vinci portrait (168 x 254; 10K)
TXT: biography of Leonardo da Vinci
IMG: The 'Arnovalley', the first known and dated work of Leonardo da Vinci (220 x 148; 13K)
1530
Theoretical description of how longitude may be determined using difference of times by a clock and the associated observed change in star positions (not implemented)- Regnier Gemma-Frisius (1508-1555), Leuven, Belgium [89].
PIC: Gemma Frisius portrait (90 x 109; 4K)
TXT: Frisius biography
1533
Description of how to determine mapping locations by triangulation, from similar triangles, and with use of angles w.r.t meridians- Regnier Gemma-Frisius (1508-1555), Leuven, Belgium [90].
PIC: Gemma Frisius at his desk surrounded by instruments and books (200 x 139; 30K) .
FIG: Image from Peter Apianius Cosmographia, edited by Gemma Frissius (383 x 503; 70K)
FIG: Gemma-Frisius Diagram of triangulation (272 x 400; 21K)
TXT: Frisius biography
TXT: Cosmographia web site
1545
The first published illustration of a camera obscura, used to record an eclipse of the sun, on January 24, 1544.- Regnier Gemma-Frisius (1508-1555), Leuven, Belgium [103]. Added:: 12/29/01
IMG: Camera obscura (357 x 250; 40K)
FIG: Camera obscura (485 x 340; 90K)
TXT: Adventures in Cybersound: The Camera Obscura
TXT: Science, Optics and You - Timeline, 1000-1599
1550
Trigonometric tables (published 1596 posthumously)- Georg Joachim Rheticus (1514-1574), Germany. Added:: 12/10/00
TXT: Rheticus biography
1556
Development of a method to fix position and survey land using compass-bearing and distance. (Tartaglia is better known for discovering a method to solve cubic equations) - Niccolo Fontana Tartaglia (1499-1557), Italy [279]. Added:: 04/10/03
PIC: Tartaglia portrait (268 x 326; 19K)
TXT: Tartaglia biography
1562
Liber de Ludo Alaea, a practical guide to gambling, containing the first systematic computation of probabilities; written in 1562, but not published until 1663.- Gerolamo Cardano (1501-1576), Italy [39,55]. Added:: 06/25/05:YL
PIC: Gerolamo Cardano portrait (250 x 304; 24K)
TXT: Cardano (Galileo project)
TXT: Cardano biography
1569
Invention of cylindrical projection for portraying the globe on maps, to preserve straightness of rhumb lines- Gerardus Mercator (1512-1594), Belgium [258]. Added:: 11/22/00
PIC: Mercator portrait (356 x 400; 34K)
FIG: Mercator's 1569 Nova et Aucta Orbis Terrae map (495 x 643; 145K)
TXT: Mercator biography, with related links
TXT: Mercator biography, with images
1570
The first modern atlas, Teatrum Orbis Terrarum- Abraham Ortelius (Ortel) (1527-1598), Antwerp, Belgium [219]. Added:: 05/18/01
PIC: Ortelius portrait (160 x 217; 18K)
IMG: Map of the Netherlands, small (200 x 147; 32K)
FIG: Map of the Netherlands, medium (590 x 435; 255K)
FIG: Ortelius world map, from De Camp 1970 (700 x 874; 174K)
TXT: Overview of Ortelius and the Teatrum
TXT: Maps from Teatrum Orbis Terrarum
1572
Improvements in instruments for accurately measuring positions of stars and planets, providing the most accurate catalog on which later discoveries (e.g., Kepler's laws) would be based-Tycho Brahe (1546-1601), Denmark. Added:: 2/15/05
PIC: Tycho Brahe portrait (280 x 306; 27K)
FIG: Tycho Brahe's wall quadrant (290 x 450; 35K)
FIG: Parallax diagram (286 x 372; 31K)
TXT: Tycho Brahe ``home page''
TXT: Galileo project summary of Brahe
TXT: Tycho Brahe biography
1581
Discovery of isosynchronous property of the pendulum (to be used for clocks and measurement)- Galileo Galilei (1564-1642), Italy. Added:: 12/10/00
TXT: Properties of the pendulum
TXT: Galileo's pendulum experiments


Images: Pre-1600
Pre-1600