The 18th century witnessed, and participated in, the initial germination of the seeds of visualization which had been
planted earlier. Map-makers began to try to show more than just geographical position on a map. As a results, new
graphic forms (isoline
s and contour
s) were invented, and thematic mapping of physical quantities took root.
Towards the end of this century, we see the first attempts at the thematic mapping of geologic, economic, and medical
data.
Abstract graphs, and graphs of functions were introduced, along with the early beginnings of statistical theory
(measurement error) and systematic collection of empirical data. As other (economic and political) data began to
be collected, some novel visual forms were invented to portray them, so the data could ``speak to the eyes''.
As well, several technological innovations provided necessary nutrients. These facilitated the reproduction of data
images (color printing, lithography), and other developments eased the task of creating them. Yet, most of these new
graphic forms appeared in publications with limited circulation, unlikely to attract wide attention.
- 1701
-
Contour maps showing curves of equal value (an isogonic map, lines of equal
magnetic declination for the world, possibly the first contour map of a data-based variable)-
Edmond Halley (1656-1742), England
[120,282].
IMG: Halley isogonic map (400 x 468; 57K)
FIG: National maritime museum, Halley magnetic chart
TXT: Halley biography
- 1710
-
Invention of three-color printing- Jacob Cristoph Le Blon (1667-1741), Germany.
TXT: Le Blon biography
TXT: Origins of the art of colour reproduction
TXT: Color reproduction
- 1711
-
First test of statistical significance based on deviation between observed data and a null hypothesis (used to show that the guiding hand of a devine being could be discerned in the
nearly constant ratio of male to female births in London over 1629-1710)- John Arbuthnot (1667-1735), England [7,20].
PIC: Arbuthnot portrait (268 x 326; 14K)
TXT: Arbuthnot biography
FIG: Graph of the sex ratio from 1620-1710
- 1712
-
Literal line graph, inspired by observation of nature (section of hyperbola, formed by capillary action of colored water between two glass plates)- Francis Hauksbee (1666-1713), England [129].
- 1724
-
Abstract line graph (of barometric observations), not analyzed- Nicolaus Samuel Cruquius (1678-1758), Netherlands [54].
- 1727
-
Experiments paving the way to the development of photography: Images obtained by action of light on a mixture of chalk, nitric acid, and silver salts- Johann Heinrich Schulze (1687-1744), Germany.
PIC: Schultze portrait (132 x 181; 7K)
TXT: Schulze biographical blurb
- 1733
-
The normal distribution, derived as the limit of the binomial distribution- Abraham de
Moivre (1667-1754), England [57,58].

PIC: de Moivre portrait
TXT: Wikipedia: Normal distribution
TXT: Maty's (1755) biography of Abraham De Moivre
The normal distribution was first introduced by de Moivre in an article in 1733
(reprinted in the second edition of his The Doctrine of Chances, 1738).
Laplace \cite{Laplace:1812} later extended this in his book Analytical Theory of Probabilities.
A further generalization, to the \ix{central limit theorem} occurred later.
- 1736-1755
-
Development of the use of polar coordinates for the representation of functions. Newton's Method of Fluxions was written about 1671, but not published until 1736. Jacob Bernoulli published a derivation of the idea
in 1691. [267,p. 324] attributes the development of polar coordinates to Fontana, with no date.- Isaac Newton (1643-1727), England, and Gregorio Fontana (1735-1803) and Jacob Bernoulli (1654-1705) [267,p. 324].
1671 is probably too early; 1736--1755 would probably be more appropriate. There are earlier references to Hipparchus (190-120BC) regarding the use of polar coordinates in establishing stellar positions, and Abu Arrayhan Muhammad ibn Ahmad al-Biruni (1021) regarding the use of three rectangular coordinates to establish a point in space.
- 1741
-
Beginnings of the study of population statistics (demography)- Johann Peter Süssmilch (1707-1767), Germany [131,274].
TXT: French translation of ``Die göttliche ordnung'', 1741
IMG: Sussmilch portrait (191 x 264; 51K)
IMG: Image of a page from Sussmilch's book (421 x 341; 29K)
- 1748
-
First use of the term ``statistik.'' The word ``statistics'' was first used by Zimmerman in 1787. (For the earlier use of ``statist'', ``statista'' and other
terms, see [152].)- Gottfried Achenwall (1719-1772), Germany [2,331].
TXT: Achenwall biography
TXT: Achenwall Wikipedia entry
From \cite[p. 32]{Walker:1929}
- 1750-1755
-
Beginnings of the estimation of m unknown quantities from n emipirical equations (where n > m), taking account of the possibility of errors in the observations (later supplanted by the method of least squares)- Johanes Tobias Mayer (1723-1762), Germany and Rogerius Josephus Boscovich (1711-1787) [69,185,189].
TXT: Mayer biography
TXT: Boscovich biography
PIC: Boscovich, on the Croatian dinar
- 1752
-
Introduction of a notation which gives a name and address to every possible point in 3D space, (x,y,z).- Leonhard Euler (1707-1783), Switzerland [67].
TXT: De'couverte d'un nouveau principe de mecanique
TXT: Euler biography:
To find the true place of the body at each instant, one only needs to locate it at the same time in respect to the three fixed planes, each perpendicular to the others \cite{Euler:1752}[p. 89].
- 1752
-
Contour map- Phillippe Buache (1700-1733), France [35].
IMG: Buache contour map icon (116 x 90; 2K)
FIG: Buache's 1770 Carte physique ou Geographie naturelle de la France (483 x 386; 58K)
- 1753
-
``Carte chronologique'': An annotated timeline of history (from Creation) on a 54-foot scroll, including names and descriptive events, grouped
thematically, with symbols denoting character (martyr, tyrant, heretic, noble, upright, etc.) and profession (painter, theologian, musician, monk, etc.)- Jacques Barbeu-Dubourg (1709-1779), France [70,311]
.
FIG: Dubourg scroll, closed (690 x 595; 65K)
FIG: Dubourg scroll, opened ((466 x 487; 72K)
- 1758-1772
-
Diagrams developed to represent color systems. In 1758, Mayer developed a system
of constructing and naming many of the possible colours. Lambert extended this
with a 3D pyramid indicating ``depth'' (saturation).-
Johanes Tobias Mayer (1723-1762),
Moses Harris (1731-1785) and Johann Heinrich Lambert (1728-1777), Germany [169,190,124].
FIG: Johann Heinrich Lambert's color pyramid, from [169] (771 x 582; 510k)
FIG: Tobias Mayer's colour pyramid, from [190] (195 x 184; 596k)
FIG: Moses Harris' prismatic colour mixture system, from[124] (228 x 264; 596k)
Lambert wanted to extend the coverage of the system to include the concept of depth. He believed that the colour pyramid would be useful to textile merchants to decide if they stocked all the colours, and to dyers and printers as a source of inspiration.
- 1760
-
Curve-fitting and interpolation from empirical data points-
Johann Heinrich Lambert (1728-1777), Germany [167].
PIC: Lambert portrait (192 x 248; 20K)
TXT: Lambert biography
- 1763
-
Graph of the beta density- Thomas Bayes (1702-1761), England [15].
PIC: Bayes portrait (304 x 326; 47K)
IMG: Bayes' Graph of the beta density (294 x 334; 4K)
TXT: Essay towards solving a problem in the doctrine of chances
TXT: Bayes biography
TXT: Bayes biography by D. R. Bellhouse
- 1765
-
Theory of measurement error as deviations from regular graphed line. (Lambert made the observation that ``a diagram does incomparably better
service here than a table.''[286,p. 204]- Johann Heinrich Lambert (1728-1777), Germany [168,Vol. 1, pp. 424-488].
- 1765
-
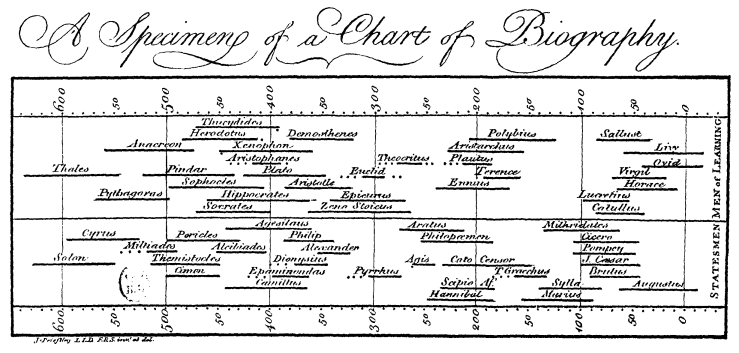
Historical timeline (life spans of 2,000 famous people, 1200 B.C. to 1750 A.D.), quantitative comparison by means of bars- Joseph Priestley (1733-1804), England [242].
PIC: Priestley portrait (216 x 192; 3K)
IMG: Priestley's specimen chart of biography (739 x 353; 69K)
TXT: Priestley biography
- 1767-1796
-
Repeated systematic application of graphical analysis (line graphs applied to empirical measurements) - Johann Heinrich Lambert (1728-1777), Germany.
FIG: Graph of evaporation of water vs. time (595 x 454; 30K)
FIG: Graph of rate of evaporation of water vs. temperature (254 x 337; 8.9K)
Lambert was one of the first to use graphs to analyze experimental data, and to use graphical calculation, e.g., computing the slopes of curves to estimate rates of change.
- 1776
-
Development of descriptive geometry, that leads to engineering drawing- Gaspard Monge (1746-1818), Beaune, France [280,281].
PIC: Monge portrait (395 x 512; 85K)
FIG: Monge's system of multiple projections
TXT: Historical development of graphics
TXT: Monge's biography
Monge's work, Descriptive geometry, was the first consciously formulated exposition of the science of orthographic projection and descriptive geometry. Sylvestre Lacriux discovered the principles of projection independently about the same time as Monge. Jean Pierre Hackette added new material to Monge's descriptive geometry and published a book on this subject in 1822.
- 1778
-
Geological map (distribution of soils, minerals)- Johann Friedrich von Charpentier (1738-1805), Germany [41].
TXT: von Charpentier bio blurb (german)
- 1779
-
Graphical analysis of periodic variation (in soil temperature), and the first
semi-graphic display combining tabular and graphical formats- Johann Heinrich Lambert (1728-1777), Germany [170,121].
IMG: Lambert
graphical table of temperatures (120 x 98; 9K)
FIG: Lambert graphical table of temperatures (570 x 456; 66K)
IMG: Lambert graph of solar
warming vs. lattitude icon (120 x 95; 8K)
FIG: Lambert graph of solar warming vs. lattitude (754 x 579; 92K)
- 1782
-
Statistical map of production in Europe, possibly the first economic and thematic map (shows geographic distribution of 56 commodities produced in Europe)- August Friedrich Wilhelm Crome , Germany [49].
PIC: Crome portrait (552 x 584; 31K)
TXT: Wikipedia bio (German)
- 1782
-
First topographical map- Marcellin du Carla-Boniface , France [40].
IMG: du Carla-Boniface
topographical map icon (90 x 120; 13K)
FIG: du Carla-Boniface map (447 x 597; 149K)
- 1782
-
Use of geometric, proportional figures (squares) to compare demographic quantities by superposition, an early ``tableau graphique''- Charles de Fourcroy , France [76].
IMG: de Fourcroy's proportional squares (346 x 408; 38K)
IMG: de Fourcroy's proportional squares (600 x 709; 94K)
TXT: Description of de Fourcroy, from Palsky
- 1785
-
Superimposed squares to compare areas (of European states)- August Friedrich Wilhelm Crome , Germany [50,214].
FIG: Crome's 1820 Verhaeltness Karte
- 1786
-
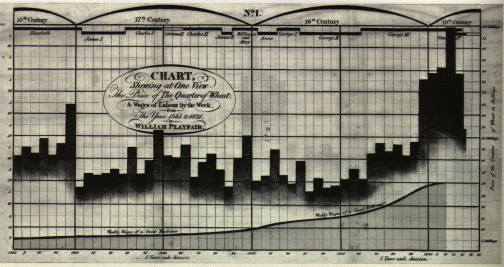
Bar chart, line graphs of economic data- William Playfair (1759-1823), England [237].
IMG: Playfair bar/line chart: price of wheat and wages (167 x 84; 8K)
FIG: Playfair bar/line chart: price of wheat and wages (504 x 267; 109K)
IMG: Playfair line graph: chart of national debt (70 x 120; 8K)
FIG: Playfair line graph: chart of national debt (390 x 669; 129K)
- 1787
-
Visualization of vibration patterns (by spreading a uniform layer of sand on a disk, and observing displacement when vibration is applied)-
Ernest Florens Friedrich Chladni (1756-1827), Germany [45].
PIC: Chladni portrait
FIG: Chladni vibration patterns, from [45] (800 x 496; 158k)
TXT: Chladni biography
TXT: High frequency kink interaction
Chladni is known as the father of acoustics; he also invented the euphonium.
- 1794
-
Patenting and sale of printed graph paper, printed with a rectangular coordinate grid, attests to the growing use of Cartesian coordinates- Dr. Buxton , England
- 1795
-
Multi-number graphical calculation (proto-nomogram: contours applied to multiplication table, later rectified by
Lalanne [165])- Louis Ézéchiel Pouchet (1748-1809), France [240].
IMG: Pouchet chart icon (120 x 115; 10K)
FIG: Pouchet's chart of the multiplication table (589 x 567; 111K)
- 1796
-
Automatic recording of bivariate data (pressure vs. volume in steam engine) ``Watt Indicator,'' (invention kept secret until 1822)- James Watt (1736-1819) and John Southern , England.
PIC: James Watt portrait (180 x 249; 8.7K)
IMG: Watt Indicator icon (76 x 120; 9K)
FIG: Watt Indicator photo (892 x 1419; 177K)
FIG: Watt Indicator detail (328 x 336; 16K)
TXT: Watt biography
TXT: Wikipedia: Watt biography
- 1798
-
Invention of lithographic technique for printing of maps and diagrams (``At the time the effect of lithography ... was as great as has been the introduction [of the Xerox machine]''
[253,p. 57]) (published in several translations, 1818-19)- Aloys Senefelder (1771-1834), Germany [262].
PIC: Senefelder portrait (200 x 248; 35K)
TXT: History of lithography and portrait
TXT: Senefelder biography
- 1798
-
First maps of the incidence of disease (yellow fever), using dots and circles to show individual occurrences in waterfront areas of New York-
Valentine Seaman (1770-1817), USA [316,p. 103].
TXT: Origins of mortality mapping
FIG: Seaman's map (840 x 748; 53K)
TXT: Mapping disease: Seaman's maps