|
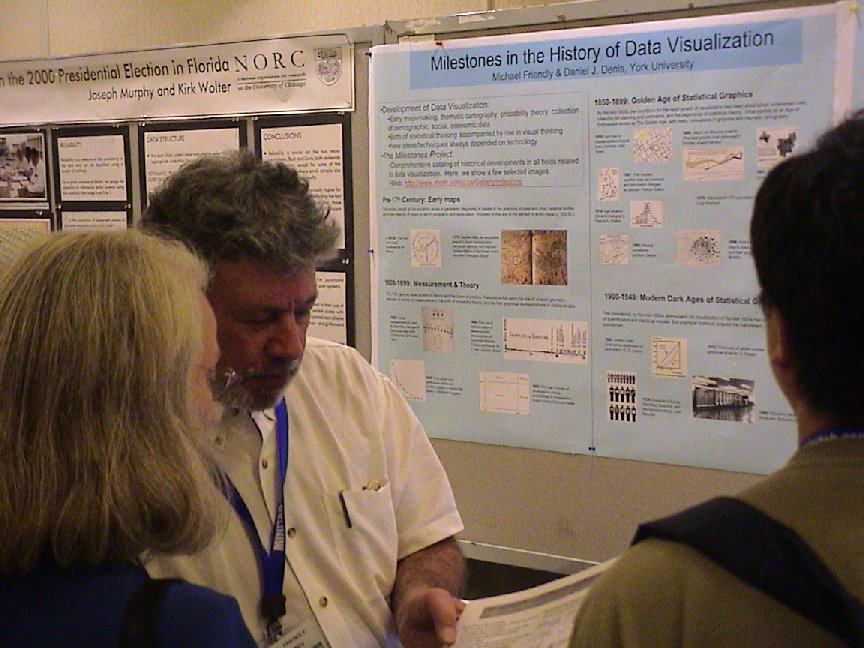
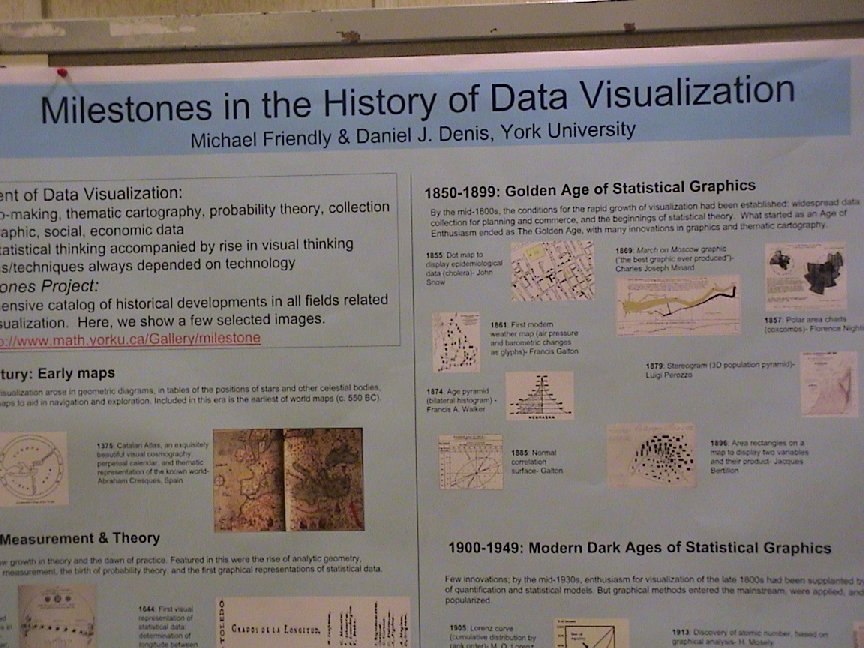
Milestones in the History of
Thematic Cartography, Statistical Graphics, and Data Visualization |
| ||||||||
|
An illustrated chronology of innovations
by Michael Friendly and Daniel J. Denis |
|
Milestones in the History of
Thematic Cartography, Statistical Graphics, and Data Visualization |
| ||||||||
|
An illustrated chronology of innovations
by Michael Friendly and Daniel J. Denis |
| Up: Gallery | Introduction | Related | References | Term Index | Category XRef | ||
|
Copyright © 2001-2008 Michael Friendly
|
 : :
|


