Psychology 6135: Psychology of Data Visualization
Michael Friendly
Spring, 2021

Course Description
Information visualization is the pictorial representation of data.
- Successful visualizations capitalize on our capacity to recognize and understand patterns presented in information displays.
- Conversely, they require that writers of scientific papers, software designers and other providers of visual displays understand what works and what does not work to convey their message.
This course will examine a variety of issues related to data visualization from a largely psychological perspective, but will also touch upon other related communities of research and practice related to this topic:
- history of data visualization,
- computer science and statistical software,
- visual design,
- human factors.
We will consider visualization methods for a wide range of types of data from the points of view of both the viewer and designer/producer of graphic displays.
Overview & Introduction
Assignment: Please prepare a 1-2 page summary of something(s) you found on the topics below. Not for grading; I’ll ask a few of you to speak on this next class.
- Blogs: Explore one or two of the blogs or web resources listed in the lecture notes, Readings, or in Resources. Find a few examples of kinds of graphs you find interesting or worth exploring more.
- Good/bad graphs Explore the literature in your area, say several issues of one journal. Find one example of a data display (graph or table) that communicates particularly well, and one example of a display that communicates badly.
Topics:
- Books, readings, blogs & web resources
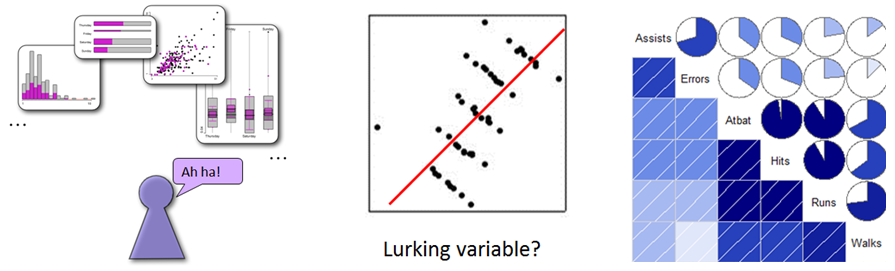
- Goals of visualization; visualization as communication
- Roles of graphics in data analysis & presentation
- Effective data display
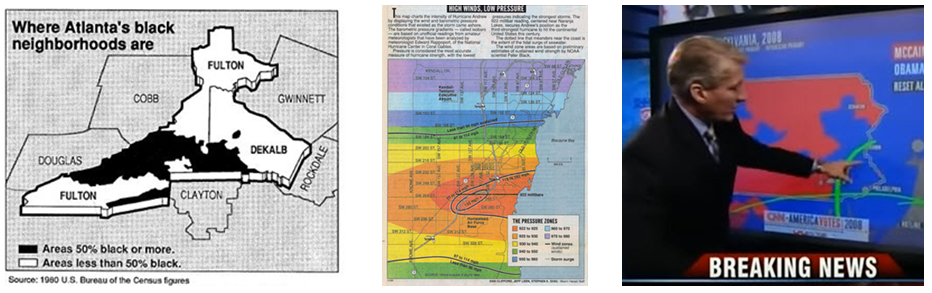
- Graphs: good/bad, excellent/evil
Readings:
Gelman & Unwin Infovis and Statistical Graphics: Different Goals, Different Looks, JCGS 2013
Howard Wainer (1984) How to Display Data Badly. American Statistician 38 137-147
Jon Schwabish The Ten Most Misleading Charts During Donald Trump’s Presidency
Check out Additional resources for Session 1
Varieties of information visualization
- Lecture notes: 1up PDF; 4up PDF
- Assignment:
- From the readings that you have done so far, find one example of a data graph that attempts to tell an interesting story of a useful topic. How well does it succeed? How could it be improved?
Topics:
- Data graphs: 1D – 3D
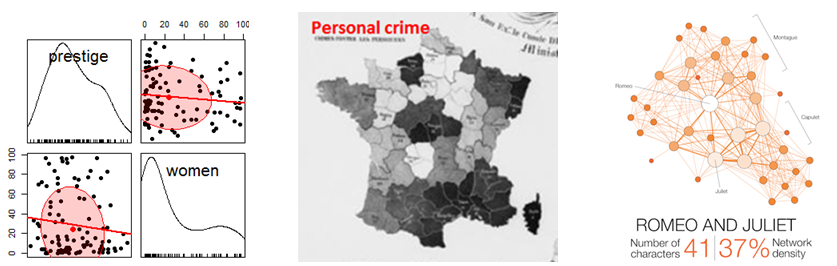
- Thematic maps
- Network and tree visualization
- Animation & interactive graphics
Readings:
Data Visuaization Catalog A handy compendium of most known graphical methods. There is also a Blog section with extended discussions of variations of a given chart type, e.g., this one on Boxplots.
Pros and Cons of Chart Taxonomies. Are these chart taxonomies good or evil?
12 Data visualizations that illustrate poverty’s biggest challenges
TED talks: Hans Rosling, The Best Stats …
TED talks: Nicholas Christakis, How Social networks Predict Epidemics
Check out Additional resources for Session 2
History of data visualization
Topics:
- Overview: The Milestones Project
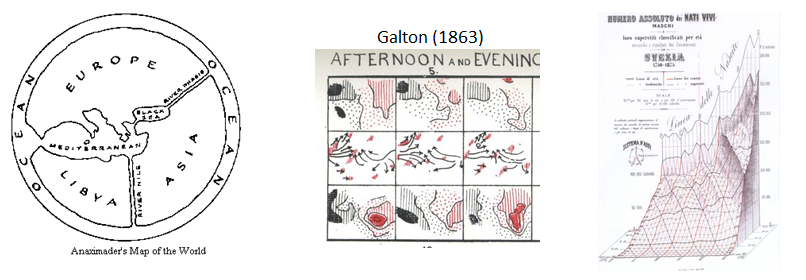
- The first statistical graph
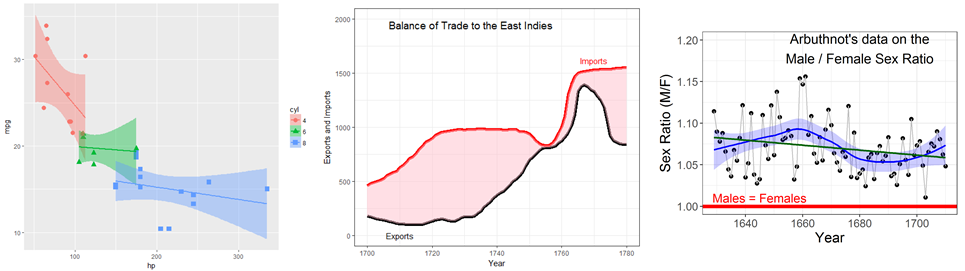
- The Big Bang: William Playfair
- Moral statistics: the birth of social science
- Graphs in the public interest: Nightingale, Farr and Snow
- The Golden Age
- Case study: Re-Visions of Minard
Readings:
Friendly, M. A Brief History of Data Visualization
Friendly etal. The First (Known) Statistical Graph: Michael Florent van Langren and the “Secret” of Longitude
Friendly, M. The Golden Age of Statistical Graphics. Statistical Science, 2008, 23, 502-535.
Friendly, M. & Denis, D. The early origins and development of the scatterplot
Phan et al. Flow Map Layout, paper; see also: Web site
Jeff Heer, A Brief History of Data Visualization, gives a lecture on his take on this history, interpreting and extending my work from a computer science perspective.
Check out Additional resources for Session 3
Graphical Perception

Topics
- Perception & Cognition
- Encoding, decoding
- Top-down vs. bottom-up processing
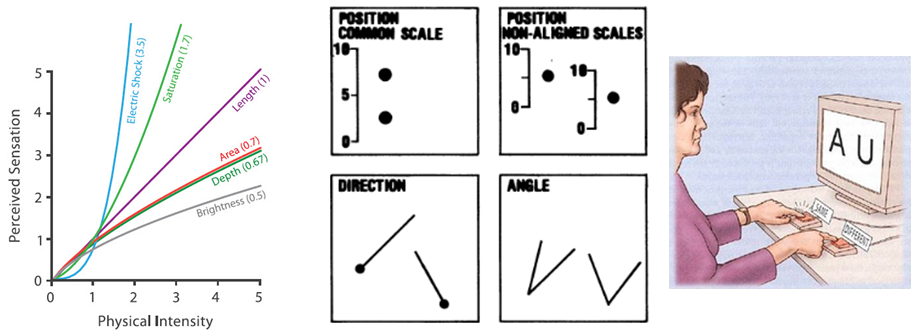
- Perceptual aspects
- Illusions
- Gestalt factors
- Accuracy of decoding
- Cognitive aspects
- Memory
- Color
Readings
- Cleveland & McGill (1984) Graphical Perception… JASA A foundation paper on understanding aspects of graph perception.
- Christopher Healey Perception in Visualization A web page on this topic, including interactive demos, animations and lots of examples
- Gordon & Finch (2015) “Statistician Heal Thyself: Have We Lost the Plot?”, JCGS, 1210-1229,
- Zeileis etal. (2009) Escaping RGBland: Selecting Colors for Statistical Graphics, Computational Statistics & Data Analysis, 53, 3259–3270.
- Zeileis et al. (2020) colorspace: A Toolbox for Manipulating and Assessing Colors and Palettes This is the latest, definitive work on designing color palettes for R. The associated web pages, http://colorspace.r-forge.r-project.org/index.html, have many vignettes and interactive color apps, also online, HCLwizard.
- Ware (2013), Information Visualization: Perception for Design, Chapter 4 (Color)
- Kennedy Elliot 39 studies abpout human perception in 30 minutes
- Why Should Engineers and Scientists Be Worried About Color?
- Stephen Few Practical Rules for Using Color in Charts
- Thomas Lin Pedersen Scico and the Colour Conundrum
- Check out Additional resources for Session 4
Human factors research: How to tell what works
Topics
- Human factors in graphic & information design
- Empirical study of graphs
- Experimental methods
- Accessibility of data visualization
- Graphical inference
Readings
- Heer & Bostock (2010), Crowdsourcing Graphical Perception…
- Skau & Kosara (2016), Arcs, Angles, or Areas: Individual Data Encodings in Pie and Donut Charts
- Haroz, Kosara, & Franconeri (2015), ISOTYPE Visualization - Working Memory, Performance, and Engagement with Pictographs
- Buja et al. (2009) Statistical inference for exploratory data analysis and model diagnostics
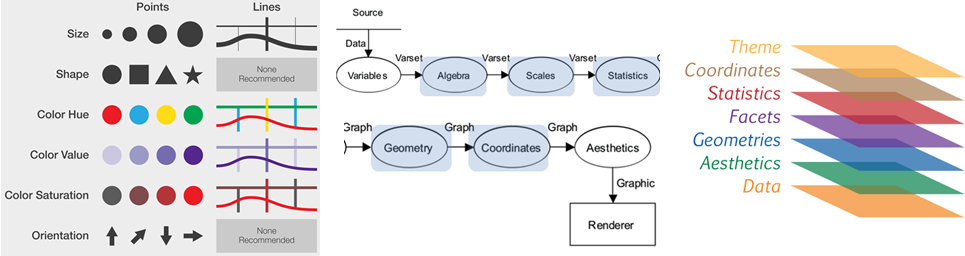
The Language of Graphs: from Bertin to GoG to ggplot2
- Lecture notes: 1up PDF; 4up PDF
- Deep questions of Data Visualization; 4up
Topics
- Early attempts at standardization of graphs
- Bertin: Semiology of Graphics
- Graphics programming languages
- Wilkinson: The Grammar of Graphics
- Wickham: ggplot2
Readings
- Palsky (1999), The debate on the standardization of statistical maps and diagrams (1857-1901)
- Wilkinson et al (2012), The Language of Graphics, JCGS, 9(3), 530-543
- Wickham (2010), A layered grammar of graphics, JCGS, 19(1), 3-28
- Kruchten (2020), Remaking Figures from Bertin’s Semiology of Graphics
- Check out Additional resources for Session 6
ggplot2: Basics
The next two sessions, devoted to developing graphs with ggplot2 and related methods will take place in the Hebb lab, Rm 059 BSB.
Lecture notes & tutorial
- Installing R & R Studio You need to install both R & R Studio to profit from this.
- Working with R Studio; 4up A mini lecture to illustrate some aspects of R Studio
- Introduction to ggplot2; 4up
- tutorial: ggplot2 tutorial: gapminder data; R script for this
Readings
getting started with ggplot This web page describes installing
ggplot2and thetidyverseof related packages. It also contains some useful links for learning to useggplot.The online chapter, Data Visualization of the book, R for Data Science is an excellent brief introduction to
ggplot2. Another chapter in this book, Graphics for Communication takes up some more advanced topics.A free online book, An Introduction to Statistical and Data Sciences via R. The focus is on the
tidyverseof R packages for data manipulation andggplot2for graphics. Also covers data modeling (regression), hypothesis testing, etc.
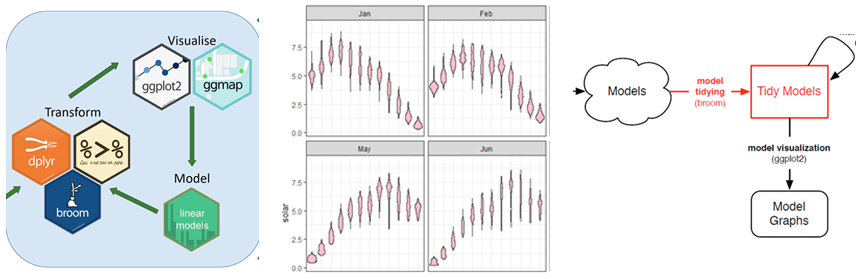
ggplot2: Going further in the tidyverse
- Lecture notes: 1up PDF; 4up PDF
- tutorial: Minard meets ggplot; R script for this
Topics
- Data wrangling: getting your data into shape
- Visualizing models: broom
- ggplot2 extensions
- tables in R
Readings
Hadley Wickham. Tidy data. The Journal of Statistical Software, vol. 59, 2014. See also the main vignette for the
tidyrpackage.David Robinson. broom: An R Package for Converting Statistical Analysis Objects Into Tidy Data Frames. See also this broom presentation
Software Carpentry. Dataframe Manipulation with dplyr. A very nice interactive tutorial on manipulating data frames using
dplyrand other tidy tools. Contains some Challenge questions and nice diagrams showing the effects ofselect,group_byand other tidy verbs. This is part of a larger series, R for Reproducible Scientific Analysis.
R examples
A collection of other R examples is available as R scripts, with some markup so that you can run them with Compile Report (Ctrl+Shift+K).
- Data tidying with dplyr and tidyr. A simple example used in the lecture of a survey of income by religeon from Pew Research.
- gapminder data: Summaries and boxplots by continent
- ggplot tutorial: gapminder data. A collection of examples showing various ways of plotting the gapminder data with
ggplot2 - gapminder data: Using
broomfor tidy model visualization. Shows the tools used to fit a collection of models forlifeExpand visualize various model summaries.
Data Journalism
Readings
- Jim Rankin, “The Quest for Electronic Data: Where Alice meets Monty Python meets Colonel Jessep”
- 8 fantastic examples of data journalism
- The Data Journalism Handbook. An edited online collection of short articles on various aspects of data journalism, now into a second volume. Highly recommended.
- Journalism in the Age of Data A slick video report on data visualization as a story-telling medium, produced by Geoff McGhee at Stanford University. Eight video chapters, with associated resources, tutorials and online tools.
- Twitter: [@WSJGraphics](https://twitter.com/WSJGraphics), [@nytgraphics](https://twitter.com/nytgraphics). Explore some of the topics/examples they’ve posted.
- Twitter: [@ddjournalism](https://twitter.com/ddjournalism) posts some interesting examples of Data Driven Journalism.
- Data Journalism Top 10: COVID-19’s Spread, Death Rates, and Curve Flattening
2021 Student presentations
These will take place June 15 & 17. Details will be posted to eClass Students page.
Copyright © 2018 Michael Friendly. All rights reserved.
friendly AT yorku DOT ca
 orcid.org/0000-0002-3237-0941